Immigrants from Central America vs Immigrants from Scotland Married-Couple Family Poverty
COMPARE
Immigrants from Central America
Immigrants from Scotland
Married-Couple Family Poverty
Married-Couple Family Poverty Comparison
Immigrants from Central America
Immigrants from Scotland
7.4%
MARRIED-COUPLE FAMILY POVERTY
0.0/ 100
METRIC RATING
324th/ 347
METRIC RANK
4.2%
MARRIED-COUPLE FAMILY POVERTY
99.9/ 100
METRIC RATING
29th/ 347
METRIC RANK
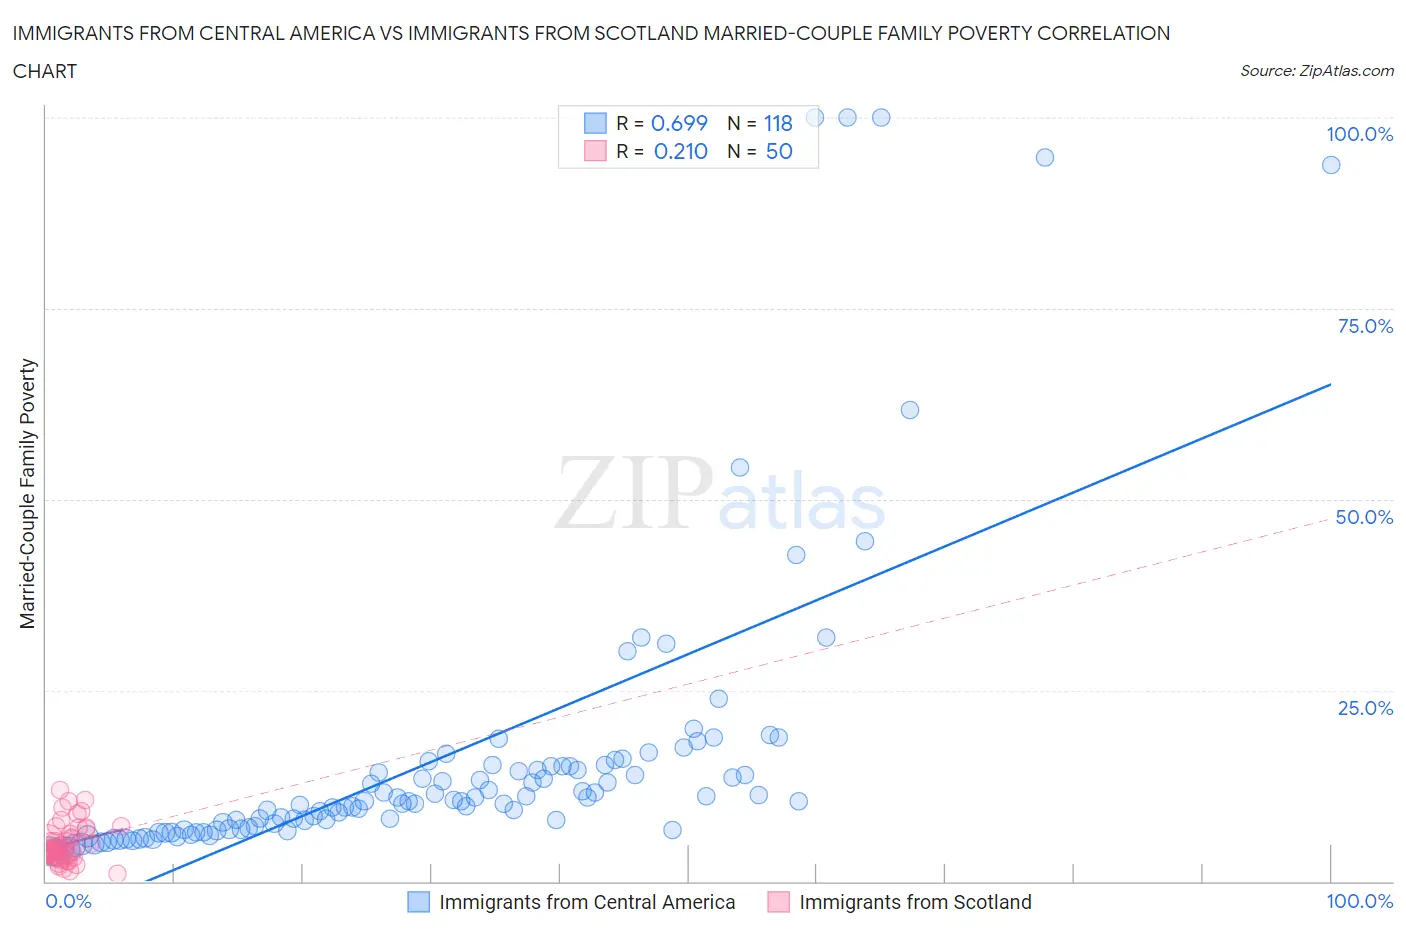
Immigrants from Central America vs Immigrants from Scotland Married-Couple Family Poverty Correlation Chart
The statistical analysis conducted on geographies consisting of 527,356,648 people shows a significant positive correlation between the proportion of Immigrants from Central America and poverty level among married-couple families in the United States with a correlation coefficient (R) of 0.699 and weighted average of 7.4%. Similarly, the statistical analysis conducted on geographies consisting of 195,462,038 people shows a weak positive correlation between the proportion of Immigrants from Scotland and poverty level among married-couple families in the United States with a correlation coefficient (R) of 0.210 and weighted average of 4.2%, a difference of 79.0%.
Married-Couple Family Poverty Correlation Summary
| Measurement | Immigrants from Central America | Immigrants from Scotland |
| Minimum | 3.8% | 1.1% |
| Maximum | 100.0% | 12.0% |
| Range | 96.2% | 11.0% |
| Mean | 16.1% | 4.9% |
| Median | 10.5% | 4.1% |
| Interquartile 25% (IQ1) | 6.8% | 3.1% |
| Interquartile 75% (IQ3) | 15.0% | 6.2% |
| Interquartile Range (IQR) | 8.2% | 3.1% |
| Standard Deviation (Sample) | 19.6% | 2.6% |
| Standard Deviation (Population) | 19.5% | 2.5% |
Similar Demographics by Married-Couple Family Poverty
Demographics Similar to Immigrants from Central America by Married-Couple Family Poverty
In terms of married-couple family poverty, the demographic groups most similar to Immigrants from Central America are Vietnamese (7.4%, a difference of 0.090%), Immigrants from Cuba (7.5%, a difference of 0.53%), Immigrants from Bangladesh (7.5%, a difference of 0.73%), Hispanic or Latino (7.5%, a difference of 0.73%), and Immigrants from Honduras (7.3%, a difference of 1.1%).
| Demographics | Rating | Rank | Married-Couple Family Poverty |
| Mexicans | 0.0 /100 | #317 | Tragic 7.2% |
| Immigrants | Guatemala | 0.0 /100 | #318 | Tragic 7.2% |
| Immigrants | Latin America | 0.0 /100 | #319 | Tragic 7.2% |
| Immigrants | Grenada | 0.0 /100 | #320 | Tragic 7.3% |
| Immigrants | Caribbean | 0.0 /100 | #321 | Tragic 7.3% |
| Immigrants | Honduras | 0.0 /100 | #322 | Tragic 7.3% |
| Vietnamese | 0.0 /100 | #323 | Tragic 7.4% |
| Immigrants | Central America | 0.0 /100 | #324 | Tragic 7.4% |
| Immigrants | Cuba | 0.0 /100 | #325 | Tragic 7.5% |
| Immigrants | Bangladesh | 0.0 /100 | #326 | Tragic 7.5% |
| Hispanics or Latinos | 0.0 /100 | #327 | Tragic 7.5% |
| Immigrants | Mexico | 0.0 /100 | #328 | Tragic 7.6% |
| Natives/Alaskans | 0.0 /100 | #329 | Tragic 8.2% |
| Paiute | 0.0 /100 | #330 | Tragic 8.3% |
| Central American Indians | 0.0 /100 | #331 | Tragic 8.3% |
Demographics Similar to Immigrants from Scotland by Married-Couple Family Poverty
In terms of married-couple family poverty, the demographic groups most similar to Immigrants from Scotland are Scandinavian (4.1%, a difference of 0.040%), Danish (4.1%, a difference of 0.15%), Finnish (4.2%, a difference of 0.24%), Cypriot (4.1%, a difference of 0.26%), and Estonian (4.2%, a difference of 0.32%).
| Demographics | Rating | Rank | Married-Couple Family Poverty |
| Immigrants | Singapore | 99.9 /100 | #22 | Exceptional 4.1% |
| Bhutanese | 99.9 /100 | #23 | Exceptional 4.1% |
| Eastern Europeans | 99.9 /100 | #24 | Exceptional 4.1% |
| Immigrants | Taiwan | 99.9 /100 | #25 | Exceptional 4.1% |
| Cypriots | 99.9 /100 | #26 | Exceptional 4.1% |
| Danes | 99.9 /100 | #27 | Exceptional 4.1% |
| Scandinavians | 99.9 /100 | #28 | Exceptional 4.1% |
| Immigrants | Scotland | 99.9 /100 | #29 | Exceptional 4.2% |
| Finns | 99.9 /100 | #30 | Exceptional 4.2% |
| Estonians | 99.9 /100 | #31 | Exceptional 4.2% |
| Greeks | 99.9 /100 | #32 | Exceptional 4.2% |
| Irish | 99.9 /100 | #33 | Exceptional 4.2% |
| Dutch | 99.9 /100 | #34 | Exceptional 4.2% |
| Europeans | 99.9 /100 | #35 | Exceptional 4.2% |
| English | 99.9 /100 | #36 | Exceptional 4.2% |