Immigrants from Burma/Myanmar vs Yuman 11th Grade
COMPARE
Immigrants from Burma/Myanmar
Yuman
11th Grade
11th Grade Comparison
Immigrants from Burma/Myanmar
Yuman
90.4%
11TH GRADE
0.0/ 100
METRIC RATING
285th/ 347
METRIC RANK
89.7%
11TH GRADE
0.0/ 100
METRIC RATING
304th/ 347
METRIC RANK
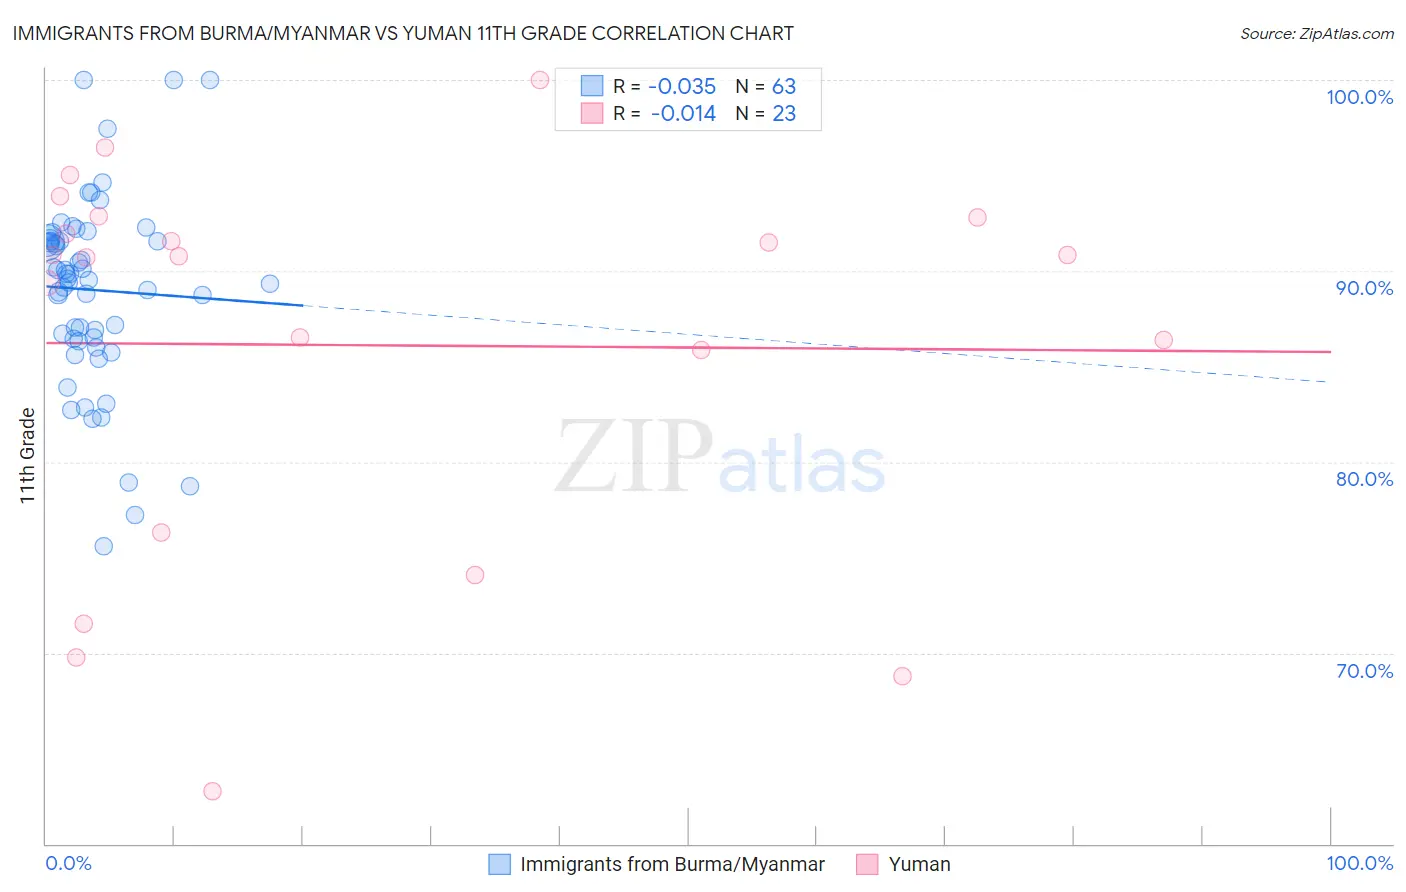
Immigrants from Burma/Myanmar vs Yuman 11th Grade Correlation Chart
The statistical analysis conducted on geographies consisting of 172,345,696 people shows no correlation between the proportion of Immigrants from Burma/Myanmar and percentage of population with at least 11th grade education in the United States with a correlation coefficient (R) of -0.035 and weighted average of 90.4%. Similarly, the statistical analysis conducted on geographies consisting of 40,696,349 people shows no correlation between the proportion of Yuman and percentage of population with at least 11th grade education in the United States with a correlation coefficient (R) of -0.014 and weighted average of 89.7%, a difference of 0.80%.
11th Grade Correlation Summary
| Measurement | Immigrants from Burma/Myanmar | Yuman |
| Minimum | 75.6% | 62.7% |
| Maximum | 100.0% | 100.0% |
| Range | 24.4% | 37.3% |
| Mean | 89.0% | 86.1% |
| Median | 89.6% | 90.8% |
| Interquartile 25% (IQ1) | 86.4% | 76.3% |
| Interquartile 75% (IQ3) | 91.6% | 92.8% |
| Interquartile Range (IQR) | 5.1% | 16.5% |
| Standard Deviation (Sample) | 4.9% | 10.2% |
| Standard Deviation (Population) | 4.9% | 10.0% |
Demographics Similar to Immigrants from Burma/Myanmar and Yuman by 11th Grade
In terms of 11th grade, the demographic groups most similar to Immigrants from Burma/Myanmar are Immigrants from West Indies (90.4%, a difference of 0.050%), Apache (90.4%, a difference of 0.060%), Pennsylvania German (90.3%, a difference of 0.080%), Immigrants from Laos (90.5%, a difference of 0.090%), and British West Indian (90.3%, a difference of 0.11%). Similarly, the demographic groups most similar to Yuman are Immigrants (89.7%, a difference of 0.0%), Immigrants from Guyana (89.7%, a difference of 0.010%), Guyanese (89.9%, a difference of 0.20%), Immigrants from Haiti (89.9%, a difference of 0.21%), and Japanese (89.9%, a difference of 0.22%).
| Demographics | Rating | Rank | 11th Grade |
| Immigrants | Laos | 0.0 /100 | #284 | Tragic 90.5% |
| Immigrants | Burma/Myanmar | 0.0 /100 | #285 | Tragic 90.4% |
| Immigrants | West Indies | 0.0 /100 | #286 | Tragic 90.4% |
| Apache | 0.0 /100 | #287 | Tragic 90.4% |
| Pennsylvania Germans | 0.0 /100 | #288 | Tragic 90.3% |
| British West Indians | 0.0 /100 | #289 | Tragic 90.3% |
| Indonesians | 0.0 /100 | #290 | Tragic 90.3% |
| Haitians | 0.0 /100 | #291 | Tragic 90.3% |
| Cubans | 0.0 /100 | #292 | Tragic 90.2% |
| Natives/Alaskans | 0.0 /100 | #293 | Tragic 90.2% |
| Immigrants | Grenada | 0.0 /100 | #294 | Tragic 90.1% |
| Immigrants | Vietnam | 0.0 /100 | #295 | Tragic 90.0% |
| Fijians | 0.0 /100 | #296 | Tragic 90.0% |
| Navajo | 0.0 /100 | #297 | Tragic 90.0% |
| Immigrants | Fiji | 0.0 /100 | #298 | Tragic 89.9% |
| Japanese | 0.0 /100 | #299 | Tragic 89.9% |
| Immigrants | Haiti | 0.0 /100 | #300 | Tragic 89.9% |
| Guyanese | 0.0 /100 | #301 | Tragic 89.9% |
| Immigrants | Guyana | 0.0 /100 | #302 | Tragic 89.7% |
| Immigrants | Immigrants | 0.0 /100 | #303 | Tragic 89.7% |
| Yuman | 0.0 /100 | #304 | Tragic 89.7% |