Shoshone vs Yuman Child Poverty Among Girls Under 16
COMPARE
Shoshone
Yuman
Child Poverty Among Girls Under 16
Child Poverty Among Girls Under 16 Comparison
Shoshone
Yuman
18.9%
CHILD POVERTY AMONG GIRLS UNDER 16
0.6/ 100
METRIC RATING
245th/ 347
METRIC RANK
27.1%
CHILD POVERTY AMONG GIRLS UNDER 16
0.0/ 100
METRIC RATING
340th/ 347
METRIC RANK
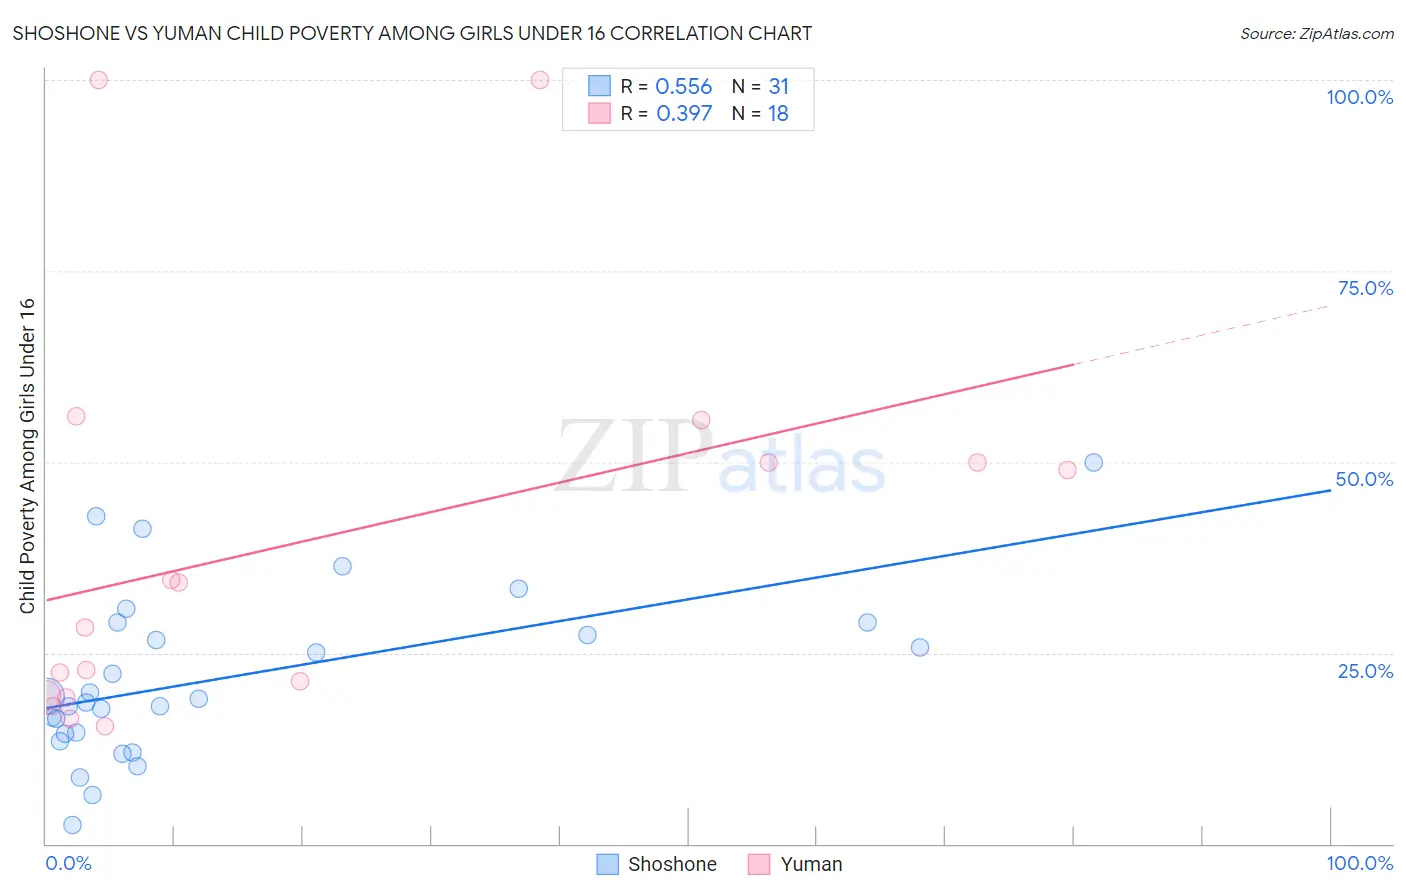
Shoshone vs Yuman Child Poverty Among Girls Under 16 Correlation Chart
The statistical analysis conducted on geographies consisting of 66,320,610 people shows a substantial positive correlation between the proportion of Shoshone and poverty level among girls under the age of 16 in the United States with a correlation coefficient (R) of 0.556 and weighted average of 18.9%. Similarly, the statistical analysis conducted on geographies consisting of 40,600,954 people shows a mild positive correlation between the proportion of Yuman and poverty level among girls under the age of 16 in the United States with a correlation coefficient (R) of 0.397 and weighted average of 27.1%, a difference of 43.6%.
Child Poverty Among Girls Under 16 Correlation Summary
| Measurement | Shoshone | Yuman |
| Minimum | 2.5% | 15.3% |
| Maximum | 50.0% | 100.0% |
| Range | 47.5% | 84.7% |
| Mean | 21.8% | 39.6% |
| Median | 18.9% | 31.3% |
| Interquartile 25% (IQ1) | 14.4% | 19.5% |
| Interquartile 75% (IQ3) | 29.0% | 50.0% |
| Interquartile Range (IQR) | 14.6% | 30.5% |
| Standard Deviation (Sample) | 11.0% | 26.2% |
| Standard Deviation (Population) | 10.8% | 25.4% |
Similar Demographics by Child Poverty Among Girls Under 16
Demographics Similar to Shoshone by Child Poverty Among Girls Under 16
In terms of child poverty among girls under 16, the demographic groups most similar to Shoshone are Immigrants from Laos (18.9%, a difference of 0.030%), Ecuadorian (18.8%, a difference of 0.12%), Immigrants from Nicaragua (18.8%, a difference of 0.18%), Immigrants from Ghana (18.9%, a difference of 0.39%), and Immigrants from Cuba (18.8%, a difference of 0.40%).
| Demographics | Rating | Rank | Child Poverty Among Girls Under 16 |
| Immigrants | Eritrea | 1.0 /100 | #238 | Tragic 18.7% |
| Marshallese | 0.9 /100 | #239 | Tragic 18.7% |
| Nigerians | 0.9 /100 | #240 | Tragic 18.7% |
| Americans | 0.8 /100 | #241 | Tragic 18.8% |
| Immigrants | Cuba | 0.7 /100 | #242 | Tragic 18.8% |
| Immigrants | Nicaragua | 0.7 /100 | #243 | Tragic 18.8% |
| Ecuadorians | 0.7 /100 | #244 | Tragic 18.8% |
| Shoshone | 0.6 /100 | #245 | Tragic 18.9% |
| Immigrants | Laos | 0.6 /100 | #246 | Tragic 18.9% |
| Immigrants | Ghana | 0.5 /100 | #247 | Tragic 18.9% |
| French American Indians | 0.3 /100 | #248 | Tragic 19.2% |
| Potawatomi | 0.3 /100 | #249 | Tragic 19.2% |
| Cape Verdeans | 0.3 /100 | #250 | Tragic 19.2% |
| Immigrants | Trinidad and Tobago | 0.3 /100 | #251 | Tragic 19.2% |
| Immigrants | Middle Africa | 0.3 /100 | #252 | Tragic 19.2% |
Demographics Similar to Yuman by Child Poverty Among Girls Under 16
In terms of child poverty among girls under 16, the demographic groups most similar to Yuman are Crow (26.4%, a difference of 2.7%), Hopi (27.9%, a difference of 2.9%), Cheyenne (26.3%, a difference of 3.1%), Pima (28.2%, a difference of 4.2%), and Yup'ik (25.8%, a difference of 4.9%).
| Demographics | Rating | Rank | Child Poverty Among Girls Under 16 |
| Blacks/African Americans | 0.0 /100 | #333 | Tragic 24.7% |
| Menominee | 0.0 /100 | #334 | Tragic 25.0% |
| Pueblo | 0.0 /100 | #335 | Tragic 25.2% |
| Sioux | 0.0 /100 | #336 | Tragic 25.6% |
| Yup'ik | 0.0 /100 | #337 | Tragic 25.8% |
| Cheyenne | 0.0 /100 | #338 | Tragic 26.3% |
| Crow | 0.0 /100 | #339 | Tragic 26.4% |
| Yuman | 0.0 /100 | #340 | Tragic 27.1% |
| Hopi | 0.0 /100 | #341 | Tragic 27.9% |
| Pima | 0.0 /100 | #342 | Tragic 28.2% |
| Immigrants | Yemen | 0.0 /100 | #343 | Tragic 29.5% |
| Navajo | 0.0 /100 | #344 | Tragic 30.5% |
| Lumbee | 0.0 /100 | #345 | Tragic 30.7% |
| Tohono O'odham | 0.0 /100 | #346 | Tragic 31.6% |
| Puerto Ricans | 0.0 /100 | #347 | Tragic 32.7% |