Immigrants from Barbados vs Immigrants from Congo Family Poverty
COMPARE
Immigrants from Barbados
Immigrants from Congo
Family Poverty
Family Poverty Comparison
Immigrants from Barbados
Immigrants from Congo
11.5%
FAMILY POVERTY
0.0/ 100
METRIC RATING
289th/ 347
METRIC RANK
11.9%
FAMILY POVERTY
0.0/ 100
METRIC RATING
307th/ 347
METRIC RANK
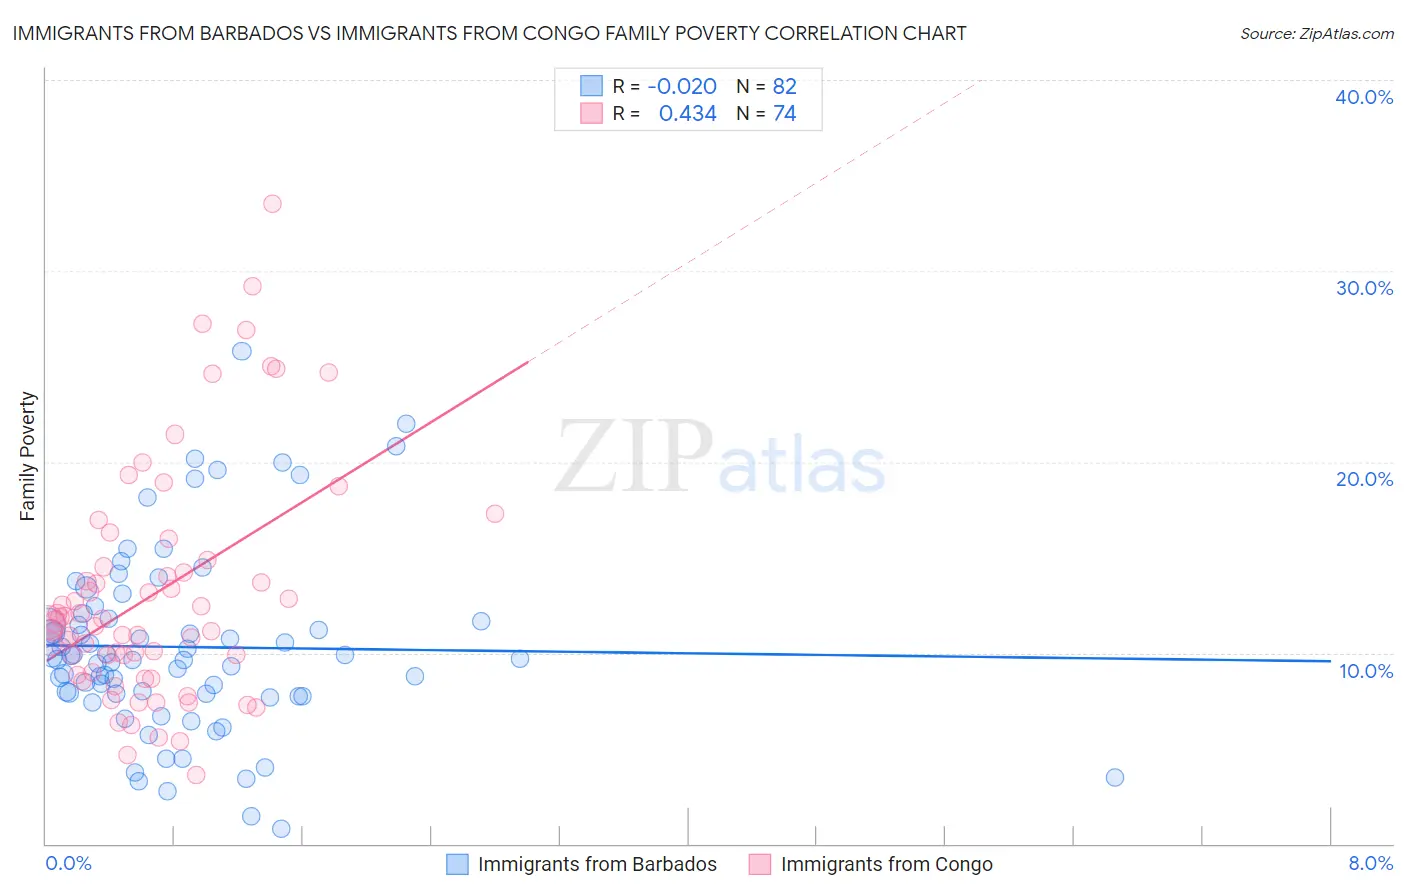
Immigrants from Barbados vs Immigrants from Congo Family Poverty Correlation Chart
The statistical analysis conducted on geographies consisting of 112,741,244 people shows no correlation between the proportion of Immigrants from Barbados and poverty level among families in the United States with a correlation coefficient (R) of -0.020 and weighted average of 11.5%. Similarly, the statistical analysis conducted on geographies consisting of 92,062,434 people shows a moderate positive correlation between the proportion of Immigrants from Congo and poverty level among families in the United States with a correlation coefficient (R) of 0.434 and weighted average of 11.9%, a difference of 3.2%.
Family Poverty Correlation Summary
| Measurement | Immigrants from Barbados | Immigrants from Congo |
| Minimum | 0.78% | 3.6% |
| Maximum | 25.8% | 33.5% |
| Range | 25.0% | 29.9% |
| Mean | 10.3% | 13.1% |
| Median | 9.7% | 11.6% |
| Interquartile 25% (IQ1) | 7.8% | 9.0% |
| Interquartile 75% (IQ3) | 11.8% | 14.5% |
| Interquartile Range (IQR) | 4.0% | 5.5% |
| Standard Deviation (Sample) | 4.8% | 6.1% |
| Standard Deviation (Population) | 4.8% | 6.1% |
Demographics Similar to Immigrants from Barbados and Immigrants from Congo by Family Poverty
In terms of family poverty, the demographic groups most similar to Immigrants from Barbados are West Indian (11.5%, a difference of 0.010%), Immigrants from Belize (11.5%, a difference of 0.050%), Haitian (11.5%, a difference of 0.070%), Immigrants from Somalia (11.5%, a difference of 0.18%), and Immigrants from Cabo Verde (11.6%, a difference of 0.62%). Similarly, the demographic groups most similar to Immigrants from Congo are Seminole (11.9%, a difference of 0.060%), Cajun (11.9%, a difference of 0.11%), Mexican (11.8%, a difference of 0.67%), Immigrants from Latin America (11.8%, a difference of 0.85%), and African (11.8%, a difference of 1.1%).
| Demographics | Rating | Rank | Family Poverty |
| Immigrants | Belize | 0.0 /100 | #288 | Tragic 11.5% |
| Immigrants | Barbados | 0.0 /100 | #289 | Tragic 11.5% |
| West Indians | 0.0 /100 | #290 | Tragic 11.5% |
| Haitians | 0.0 /100 | #291 | Tragic 11.5% |
| Immigrants | Somalia | 0.0 /100 | #292 | Tragic 11.5% |
| Immigrants | Cabo Verde | 0.0 /100 | #293 | Tragic 11.6% |
| Immigrants | St. Vincent and the Grenadines | 0.0 /100 | #294 | Tragic 11.6% |
| Immigrants | Haiti | 0.0 /100 | #295 | Tragic 11.6% |
| Choctaw | 0.0 /100 | #296 | Tragic 11.6% |
| Creek | 0.0 /100 | #297 | Tragic 11.7% |
| Immigrants | Senegal | 0.0 /100 | #298 | Tragic 11.7% |
| Dutch West Indians | 0.0 /100 | #299 | Tragic 11.7% |
| Immigrants | Bangladesh | 0.0 /100 | #300 | Tragic 11.7% |
| Bahamians | 0.0 /100 | #301 | Tragic 11.7% |
| Guatemalans | 0.0 /100 | #302 | Tragic 11.7% |
| Africans | 0.0 /100 | #303 | Tragic 11.8% |
| Immigrants | Latin America | 0.0 /100 | #304 | Tragic 11.8% |
| Mexicans | 0.0 /100 | #305 | Tragic 11.8% |
| Cajuns | 0.0 /100 | #306 | Tragic 11.9% |
| Immigrants | Congo | 0.0 /100 | #307 | Tragic 11.9% |
| Seminole | 0.0 /100 | #308 | Tragic 11.9% |