Immigrants from Burma/Myanmar vs Immigrants from Congo Master's Degree
COMPARE
Immigrants from Burma/Myanmar
Immigrants from Congo
Master's Degree
Master's Degree Comparison
Immigrants from Burma/Myanmar
Immigrants from Congo
13.5%
MASTER'S DEGREE
5.0/ 100
METRIC RATING
234th/ 347
METRIC RANK
12.6%
MASTER'S DEGREE
0.8/ 100
METRIC RATING
255th/ 347
METRIC RANK
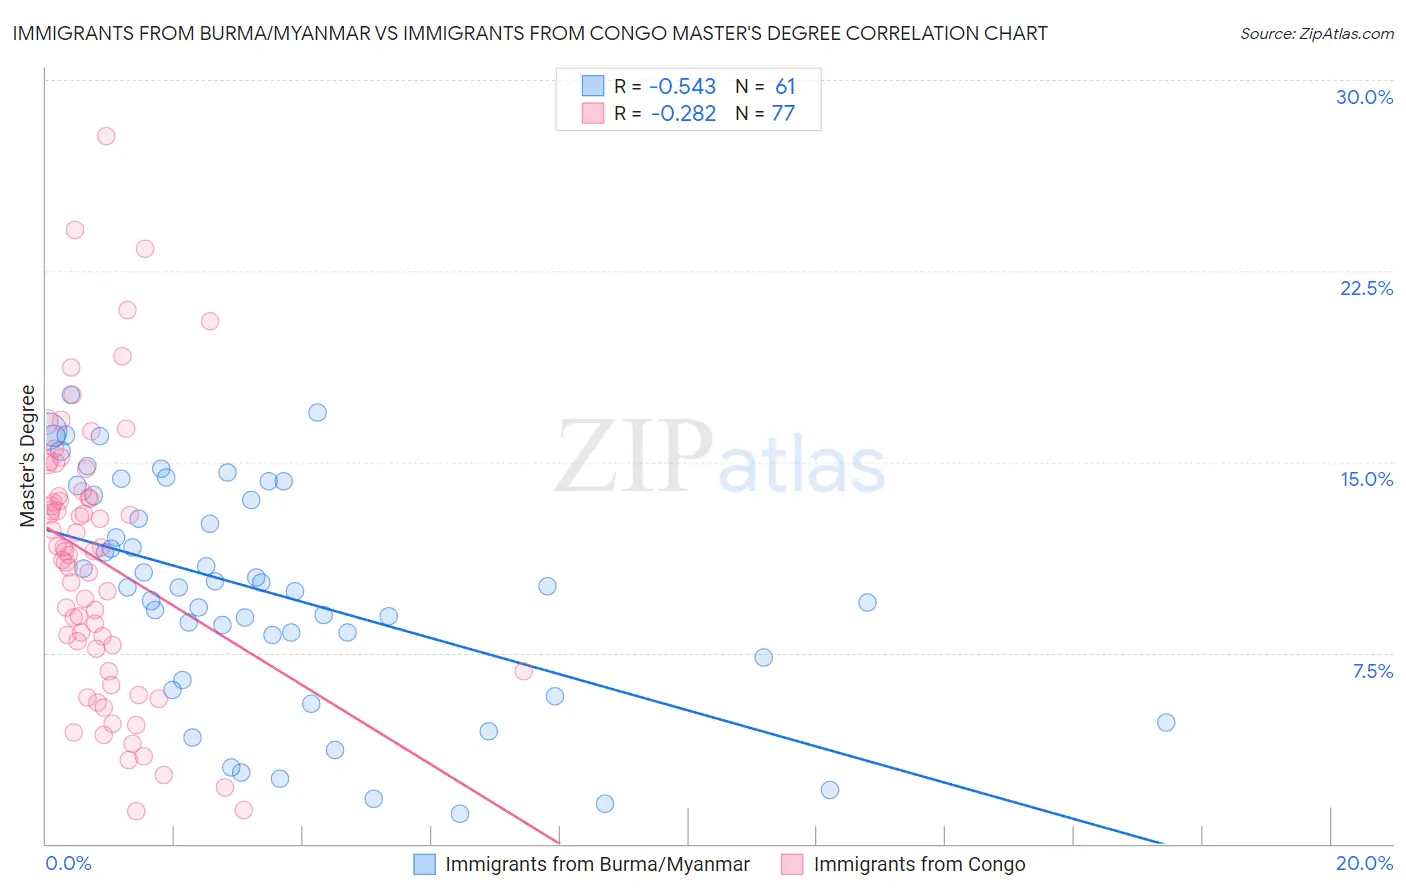
Immigrants from Burma/Myanmar vs Immigrants from Congo Master's Degree Correlation Chart
The statistical analysis conducted on geographies consisting of 172,302,674 people shows a substantial negative correlation between the proportion of Immigrants from Burma/Myanmar and percentage of population with at least master's degree education in the United States with a correlation coefficient (R) of -0.543 and weighted average of 13.5%. Similarly, the statistical analysis conducted on geographies consisting of 92,118,005 people shows a weak negative correlation between the proportion of Immigrants from Congo and percentage of population with at least master's degree education in the United States with a correlation coefficient (R) of -0.282 and weighted average of 12.6%, a difference of 7.0%.
Master's Degree Correlation Summary
| Measurement | Immigrants from Burma/Myanmar | Immigrants from Congo |
| Minimum | 1.2% | 1.3% |
| Maximum | 17.6% | 27.8% |
| Range | 16.5% | 26.5% |
| Mean | 9.9% | 11.1% |
| Median | 10.1% | 11.5% |
| Interquartile 25% (IQ1) | 6.9% | 7.2% |
| Interquartile 75% (IQ3) | 13.9% | 13.7% |
| Interquartile Range (IQR) | 7.0% | 6.5% |
| Standard Deviation (Sample) | 4.4% | 5.4% |
| Standard Deviation (Population) | 4.3% | 5.4% |
Similar Demographics by Master's Degree
Demographics Similar to Immigrants from Burma/Myanmar by Master's Degree
In terms of master's degree, the demographic groups most similar to Immigrants from Burma/Myanmar are German Russian (13.5%, a difference of 0.41%), Immigrants from Ecuador (13.6%, a difference of 0.50%), Immigrants from Guyana (13.4%, a difference of 0.52%), Immigrants from Philippines (13.6%, a difference of 0.65%), and Jamaican (13.4%, a difference of 0.75%).
| Demographics | Rating | Rank | Master's Degree |
| Immigrants | West Indies | 9.8 /100 | #227 | Tragic 13.9% |
| Whites/Caucasians | 9.1 /100 | #228 | Tragic 13.8% |
| British West Indians | 8.8 /100 | #229 | Tragic 13.8% |
| Dutch | 8.7 /100 | #230 | Tragic 13.8% |
| Guyanese | 7.6 /100 | #231 | Tragic 13.7% |
| Immigrants | Philippines | 6.0 /100 | #232 | Tragic 13.6% |
| Immigrants | Ecuador | 5.7 /100 | #233 | Tragic 13.6% |
| Immigrants | Burma/Myanmar | 5.0 /100 | #234 | Tragic 13.5% |
| German Russians | 4.5 /100 | #235 | Tragic 13.5% |
| Immigrants | Guyana | 4.4 /100 | #236 | Tragic 13.4% |
| Jamaicans | 4.1 /100 | #237 | Tragic 13.4% |
| Hmong | 4.0 /100 | #238 | Tragic 13.4% |
| Immigrants | Nonimmigrants | 3.4 /100 | #239 | Tragic 13.3% |
| Guamanians/Chamorros | 2.2 /100 | #240 | Tragic 13.1% |
| U.S. Virgin Islanders | 2.1 /100 | #241 | Tragic 13.1% |
Demographics Similar to Immigrants from Congo by Master's Degree
In terms of master's degree, the demographic groups most similar to Immigrants from Congo are Indonesian (12.6%, a difference of 0.030%), Immigrants from Dominica (12.6%, a difference of 0.070%), Immigrants from Portugal (12.6%, a difference of 0.080%), Osage (12.6%, a difference of 0.55%), and French American Indian (12.7%, a difference of 0.61%).
| Demographics | Rating | Rank | Master's Degree |
| Africans | 1.4 /100 | #248 | Tragic 12.9% |
| Cree | 1.3 /100 | #249 | Tragic 12.8% |
| Liberians | 1.3 /100 | #250 | Tragic 12.8% |
| Tlingit-Haida | 1.3 /100 | #251 | Tragic 12.8% |
| French American Indians | 1.0 /100 | #252 | Tragic 12.7% |
| Immigrants | Dominica | 0.8 /100 | #253 | Tragic 12.6% |
| Indonesians | 0.8 /100 | #254 | Tragic 12.6% |
| Immigrants | Congo | 0.8 /100 | #255 | Tragic 12.6% |
| Immigrants | Portugal | 0.8 /100 | #256 | Tragic 12.6% |
| Osage | 0.7 /100 | #257 | Tragic 12.6% |
| Immigrants | Liberia | 0.6 /100 | #258 | Tragic 12.5% |
| Japanese | 0.6 /100 | #259 | Tragic 12.5% |
| Dominicans | 0.6 /100 | #260 | Tragic 12.5% |
| Tongans | 0.6 /100 | #261 | Tragic 12.5% |
| Nicaraguans | 0.6 /100 | #262 | Tragic 12.5% |