Cypriot vs Immigrants from Congo Family Poverty
COMPARE
Cypriot
Immigrants from Congo
Family Poverty
Family Poverty Comparison
Cypriots
Immigrants from Congo
7.3%
FAMILY POVERTY
99.6/ 100
METRIC RATING
26th/ 347
METRIC RANK
11.9%
FAMILY POVERTY
0.0/ 100
METRIC RATING
307th/ 347
METRIC RANK
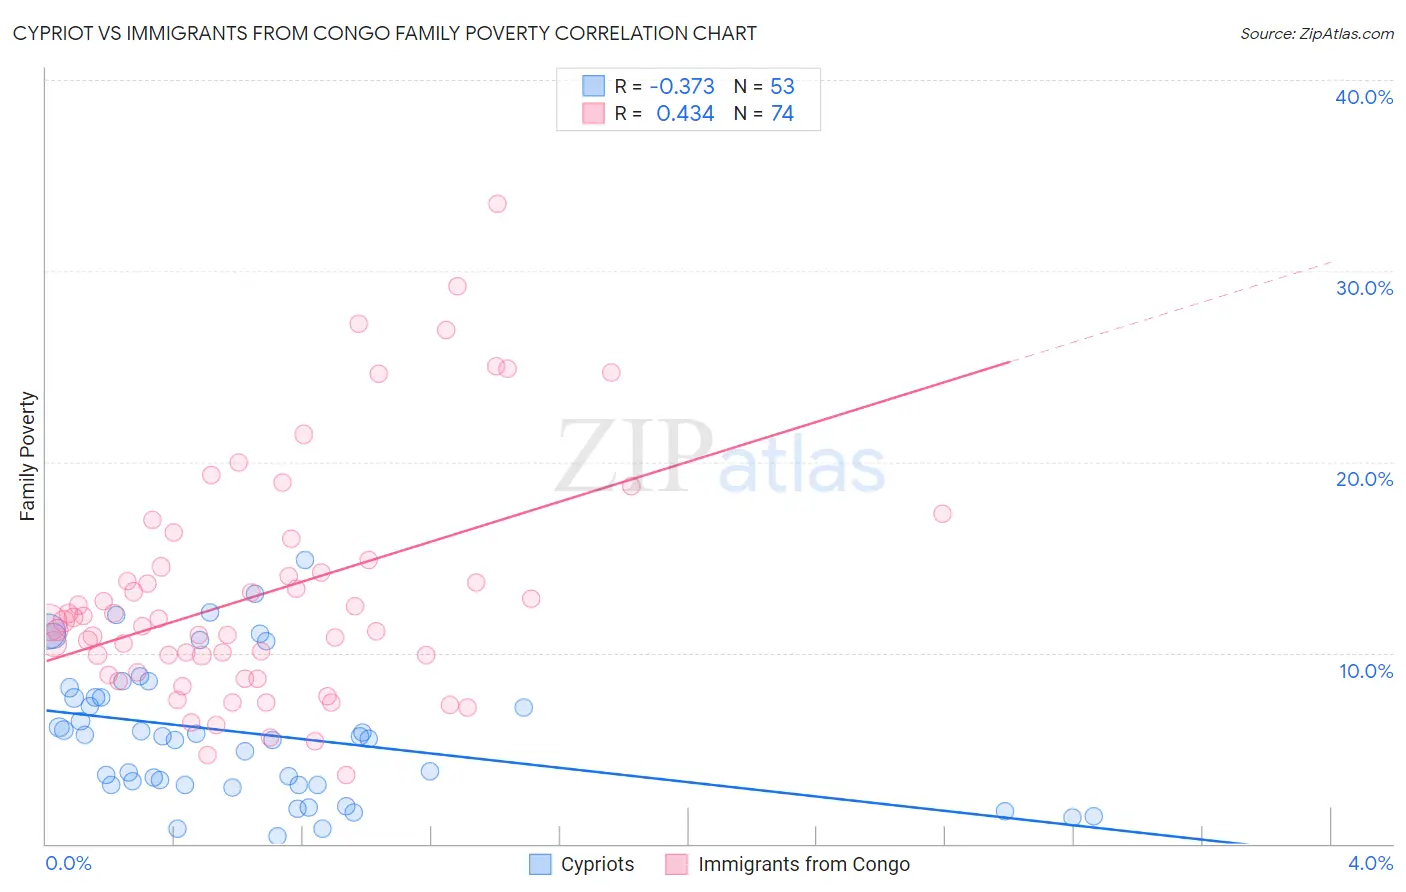
Cypriot vs Immigrants from Congo Family Poverty Correlation Chart
The statistical analysis conducted on geographies consisting of 61,784,976 people shows a mild negative correlation between the proportion of Cypriots and poverty level among families in the United States with a correlation coefficient (R) of -0.373 and weighted average of 7.3%. Similarly, the statistical analysis conducted on geographies consisting of 92,062,434 people shows a moderate positive correlation between the proportion of Immigrants from Congo and poverty level among families in the United States with a correlation coefficient (R) of 0.434 and weighted average of 11.9%, a difference of 62.1%.
Family Poverty Correlation Summary
| Measurement | Cypriot | Immigrants from Congo |
| Minimum | 0.41% | 3.6% |
| Maximum | 14.8% | 33.5% |
| Range | 14.4% | 29.9% |
| Mean | 5.8% | 13.1% |
| Median | 5.6% | 11.6% |
| Interquartile 25% (IQ1) | 3.1% | 9.0% |
| Interquartile 75% (IQ3) | 7.9% | 14.5% |
| Interquartile Range (IQR) | 4.9% | 5.5% |
| Standard Deviation (Sample) | 3.6% | 6.1% |
| Standard Deviation (Population) | 3.5% | 6.1% |
Similar Demographics by Family Poverty
Demographics Similar to Cypriots by Family Poverty
In terms of family poverty, the demographic groups most similar to Cypriots are Immigrants from Scotland (7.3%, a difference of 0.020%), Burmese (7.3%, a difference of 0.24%), Croatian (7.3%, a difference of 0.25%), Immigrants from Korea (7.4%, a difference of 0.40%), and Assyrian/Chaldean/Syriac (7.3%, a difference of 0.55%).
| Demographics | Rating | Rank | Family Poverty |
| Eastern Europeans | 99.7 /100 | #19 | Exceptional 7.2% |
| Immigrants | Hong Kong | 99.7 /100 | #20 | Exceptional 7.3% |
| Immigrants | Iran | 99.7 /100 | #21 | Exceptional 7.3% |
| Danes | 99.7 /100 | #22 | Exceptional 7.3% |
| Assyrians/Chaldeans/Syriacs | 99.7 /100 | #23 | Exceptional 7.3% |
| Croatians | 99.7 /100 | #24 | Exceptional 7.3% |
| Burmese | 99.7 /100 | #25 | Exceptional 7.3% |
| Cypriots | 99.6 /100 | #26 | Exceptional 7.3% |
| Immigrants | Scotland | 99.6 /100 | #27 | Exceptional 7.3% |
| Immigrants | Korea | 99.6 /100 | #28 | Exceptional 7.4% |
| Immigrants | Northern Europe | 99.6 /100 | #29 | Exceptional 7.4% |
| Italians | 99.6 /100 | #30 | Exceptional 7.4% |
| Czechs | 99.6 /100 | #31 | Exceptional 7.4% |
| Poles | 99.5 /100 | #32 | Exceptional 7.4% |
| Immigrants | Japan | 99.5 /100 | #33 | Exceptional 7.4% |
Demographics Similar to Immigrants from Congo by Family Poverty
In terms of family poverty, the demographic groups most similar to Immigrants from Congo are Seminole (11.9%, a difference of 0.060%), Cajun (11.9%, a difference of 0.11%), Hispanic or Latino (12.0%, a difference of 0.50%), Immigrants from Guatemala (12.0%, a difference of 0.51%), and Mexican (11.8%, a difference of 0.67%).
| Demographics | Rating | Rank | Family Poverty |
| Immigrants | Bangladesh | 0.0 /100 | #300 | Tragic 11.7% |
| Bahamians | 0.0 /100 | #301 | Tragic 11.7% |
| Guatemalans | 0.0 /100 | #302 | Tragic 11.7% |
| Africans | 0.0 /100 | #303 | Tragic 11.8% |
| Immigrants | Latin America | 0.0 /100 | #304 | Tragic 11.8% |
| Mexicans | 0.0 /100 | #305 | Tragic 11.8% |
| Cajuns | 0.0 /100 | #306 | Tragic 11.9% |
| Immigrants | Congo | 0.0 /100 | #307 | Tragic 11.9% |
| Seminole | 0.0 /100 | #308 | Tragic 11.9% |
| Hispanics or Latinos | 0.0 /100 | #309 | Tragic 12.0% |
| Immigrants | Guatemala | 0.0 /100 | #310 | Tragic 12.0% |
| Ute | 0.0 /100 | #311 | Tragic 12.1% |
| Immigrants | Central America | 0.0 /100 | #312 | Tragic 12.1% |
| Immigrants | Caribbean | 0.0 /100 | #313 | Tragic 12.2% |
| Kiowa | 0.0 /100 | #314 | Tragic 12.2% |