Immigrants from Croatia vs Immigrants from Congo Family Poverty
COMPARE
Immigrants from Croatia
Immigrants from Congo
Family Poverty
Family Poverty Comparison
Immigrants from Croatia
Immigrants from Congo
7.8%
FAMILY POVERTY
98.1/ 100
METRIC RATING
75th/ 347
METRIC RANK
11.9%
FAMILY POVERTY
0.0/ 100
METRIC RATING
307th/ 347
METRIC RANK
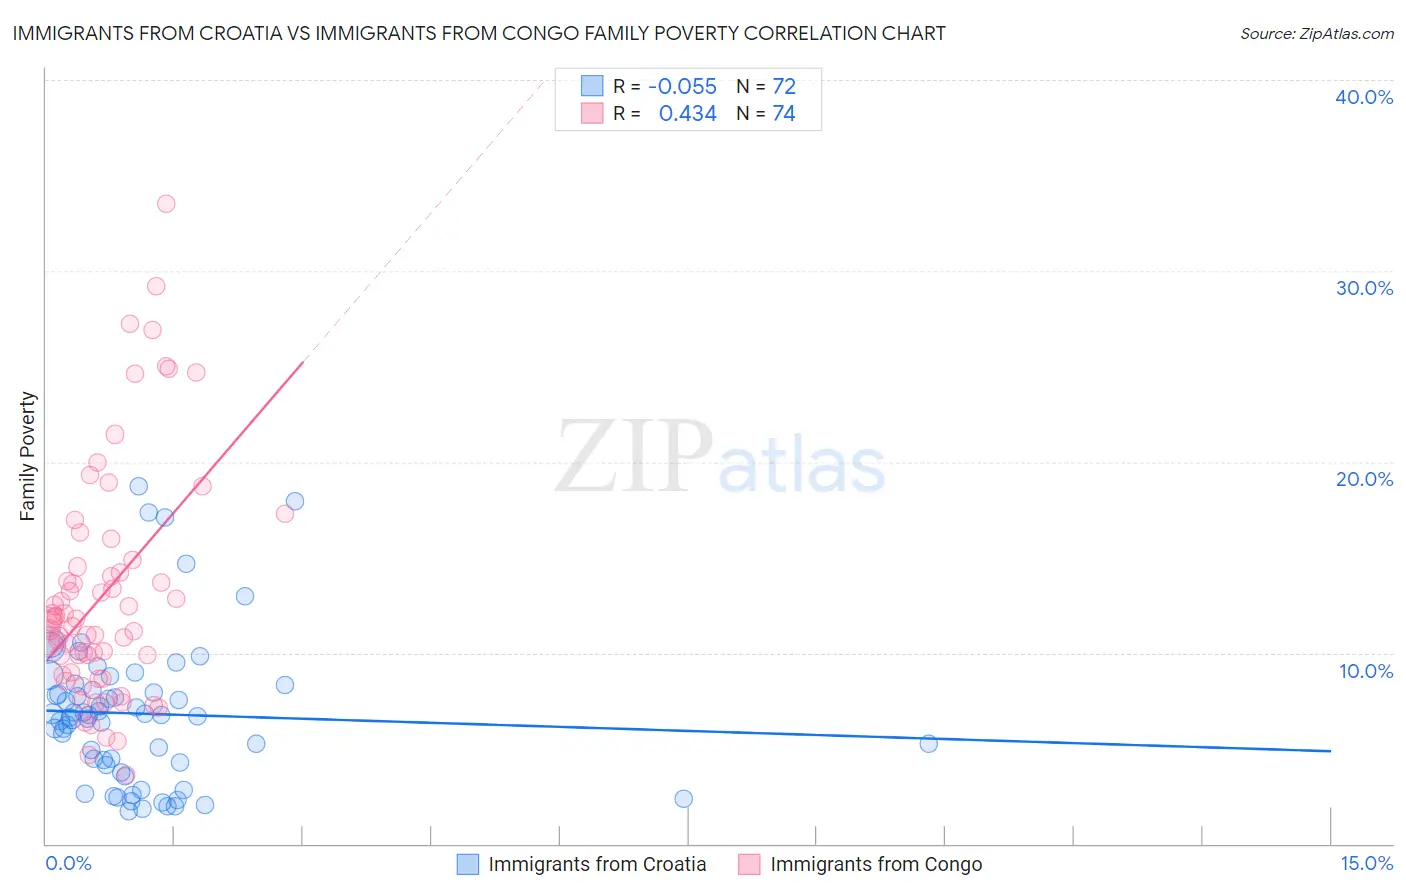
Immigrants from Croatia vs Immigrants from Congo Family Poverty Correlation Chart
The statistical analysis conducted on geographies consisting of 132,458,844 people shows a slight negative correlation between the proportion of Immigrants from Croatia and poverty level among families in the United States with a correlation coefficient (R) of -0.055 and weighted average of 7.8%. Similarly, the statistical analysis conducted on geographies consisting of 92,062,434 people shows a moderate positive correlation between the proportion of Immigrants from Congo and poverty level among families in the United States with a correlation coefficient (R) of 0.434 and weighted average of 11.9%, a difference of 51.6%.
Family Poverty Correlation Summary
| Measurement | Immigrants from Croatia | Immigrants from Congo |
| Minimum | 1.7% | 3.6% |
| Maximum | 18.7% | 33.5% |
| Range | 17.0% | 29.9% |
| Mean | 6.8% | 13.1% |
| Median | 6.7% | 11.6% |
| Interquartile 25% (IQ1) | 4.2% | 9.0% |
| Interquartile 75% (IQ3) | 8.2% | 14.5% |
| Interquartile Range (IQR) | 4.0% | 5.5% |
| Standard Deviation (Sample) | 3.9% | 6.1% |
| Standard Deviation (Population) | 3.8% | 6.1% |
Similar Demographics by Family Poverty
Demographics Similar to Immigrants from Croatia by Family Poverty
In terms of family poverty, the demographic groups most similar to Immigrants from Croatia are Immigrants from China (7.8%, a difference of 0.14%), Immigrants from Romania (7.8%, a difference of 0.21%), Austrian (7.8%, a difference of 0.21%), Immigrants from Latvia (7.9%, a difference of 0.23%), and Ukrainian (7.9%, a difference of 0.24%).
| Demographics | Rating | Rank | Family Poverty |
| Australians | 98.2 /100 | #68 | Exceptional 7.8% |
| Immigrants | Belgium | 98.2 /100 | #69 | Exceptional 7.8% |
| Immigrants | Canada | 98.2 /100 | #70 | Exceptional 7.8% |
| Cambodians | 98.2 /100 | #71 | Exceptional 7.8% |
| Immigrants | Romania | 98.2 /100 | #72 | Exceptional 7.8% |
| Austrians | 98.2 /100 | #73 | Exceptional 7.8% |
| Immigrants | China | 98.1 /100 | #74 | Exceptional 7.8% |
| Immigrants | Croatia | 98.1 /100 | #75 | Exceptional 7.8% |
| Immigrants | Latvia | 98.0 /100 | #76 | Exceptional 7.9% |
| Ukrainians | 98.0 /100 | #77 | Exceptional 7.9% |
| Immigrants | North America | 97.9 /100 | #78 | Exceptional 7.9% |
| Immigrants | Europe | 97.8 /100 | #79 | Exceptional 7.9% |
| English | 97.8 /100 | #80 | Exceptional 7.9% |
| Irish | 97.8 /100 | #81 | Exceptional 7.9% |
| Immigrants | Poland | 97.8 /100 | #82 | Exceptional 7.9% |
Demographics Similar to Immigrants from Congo by Family Poverty
In terms of family poverty, the demographic groups most similar to Immigrants from Congo are Seminole (11.9%, a difference of 0.060%), Cajun (11.9%, a difference of 0.11%), Hispanic or Latino (12.0%, a difference of 0.50%), Immigrants from Guatemala (12.0%, a difference of 0.51%), and Mexican (11.8%, a difference of 0.67%).
| Demographics | Rating | Rank | Family Poverty |
| Immigrants | Bangladesh | 0.0 /100 | #300 | Tragic 11.7% |
| Bahamians | 0.0 /100 | #301 | Tragic 11.7% |
| Guatemalans | 0.0 /100 | #302 | Tragic 11.7% |
| Africans | 0.0 /100 | #303 | Tragic 11.8% |
| Immigrants | Latin America | 0.0 /100 | #304 | Tragic 11.8% |
| Mexicans | 0.0 /100 | #305 | Tragic 11.8% |
| Cajuns | 0.0 /100 | #306 | Tragic 11.9% |
| Immigrants | Congo | 0.0 /100 | #307 | Tragic 11.9% |
| Seminole | 0.0 /100 | #308 | Tragic 11.9% |
| Hispanics or Latinos | 0.0 /100 | #309 | Tragic 12.0% |
| Immigrants | Guatemala | 0.0 /100 | #310 | Tragic 12.0% |
| Ute | 0.0 /100 | #311 | Tragic 12.1% |
| Immigrants | Central America | 0.0 /100 | #312 | Tragic 12.1% |
| Immigrants | Caribbean | 0.0 /100 | #313 | Tragic 12.2% |
| Kiowa | 0.0 /100 | #314 | Tragic 12.2% |