Immigrants from Burma/Myanmar vs Immigrants from Congo Nursery School
COMPARE
Immigrants from Burma/Myanmar
Immigrants from Congo
Nursery School
Nursery School Comparison
Immigrants from Burma/Myanmar
Immigrants from Congo
96.9%
NURSERY SCHOOL
0.0/ 100
METRIC RATING
320th/ 347
METRIC RANK
97.6%
NURSERY SCHOOL
0.7/ 100
METRIC RATING
254th/ 347
METRIC RANK
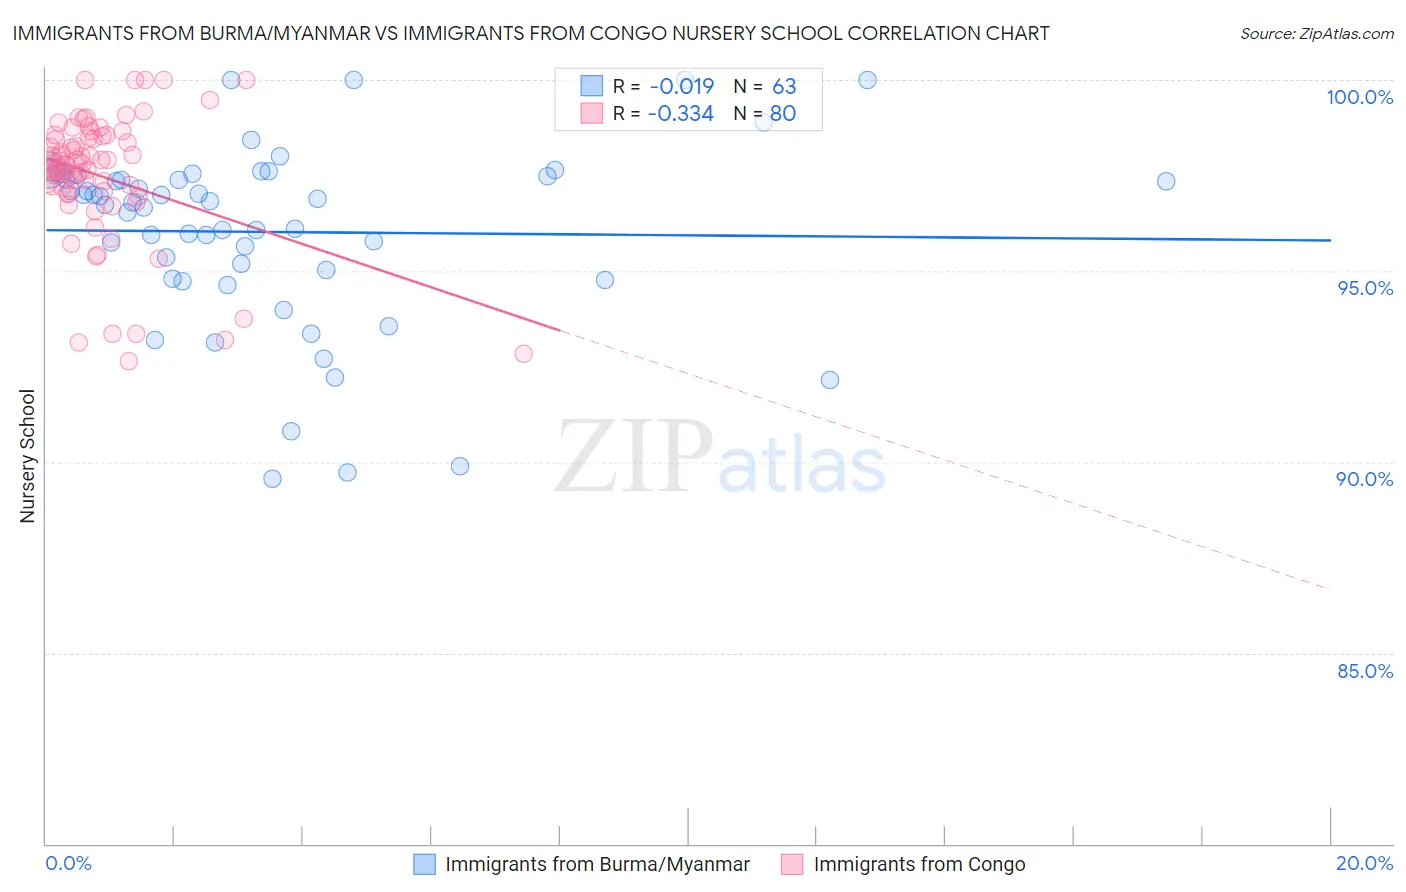
Immigrants from Burma/Myanmar vs Immigrants from Congo Nursery School Correlation Chart
The statistical analysis conducted on geographies consisting of 172,338,093 people shows no correlation between the proportion of Immigrants from Burma/Myanmar and percentage of population with at least nursery school education in the United States with a correlation coefficient (R) of -0.019 and weighted average of 96.9%. Similarly, the statistical analysis conducted on geographies consisting of 92,124,753 people shows a mild negative correlation between the proportion of Immigrants from Congo and percentage of population with at least nursery school education in the United States with a correlation coefficient (R) of -0.334 and weighted average of 97.6%, a difference of 0.76%.
Nursery School Correlation Summary
| Measurement | Immigrants from Burma/Myanmar | Immigrants from Congo |
| Minimum | 89.6% | 92.6% |
| Maximum | 100.0% | 100.0% |
| Range | 10.4% | 7.4% |
| Mean | 96.0% | 97.5% |
| Median | 96.8% | 97.8% |
| Interquartile 25% (IQ1) | 94.8% | 97.1% |
| Interquartile 75% (IQ3) | 97.5% | 98.5% |
| Interquartile Range (IQR) | 2.7% | 1.4% |
| Standard Deviation (Sample) | 2.4% | 1.7% |
| Standard Deviation (Population) | 2.4% | 1.7% |
Similar Demographics by Nursery School
Demographics Similar to Immigrants from Burma/Myanmar by Nursery School
In terms of nursery school, the demographic groups most similar to Immigrants from Burma/Myanmar are Immigrants from Laos (96.9%, a difference of 0.0%), Immigrants from Bangladesh (96.9%, a difference of 0.0%), Immigrants from Guyana (96.9%, a difference of 0.020%), Mexican American Indian (96.9%, a difference of 0.020%), and Immigrants from Honduras (96.9%, a difference of 0.030%).
| Demographics | Rating | Rank | Nursery School |
| Hondurans | 0.0 /100 | #313 | Tragic 97.0% |
| Cape Verdeans | 0.0 /100 | #314 | Tragic 97.0% |
| Immigrants | Nicaragua | 0.0 /100 | #315 | Tragic 96.9% |
| Immigrants | Belize | 0.0 /100 | #316 | Tragic 96.9% |
| Immigrants | Ecuador | 0.0 /100 | #317 | Tragic 96.9% |
| Immigrants | Guyana | 0.0 /100 | #318 | Tragic 96.9% |
| Immigrants | Laos | 0.0 /100 | #319 | Tragic 96.9% |
| Immigrants | Burma/Myanmar | 0.0 /100 | #320 | Tragic 96.9% |
| Immigrants | Bangladesh | 0.0 /100 | #321 | Tragic 96.9% |
| Mexican American Indians | 0.0 /100 | #322 | Tragic 96.9% |
| Immigrants | Honduras | 0.0 /100 | #323 | Tragic 96.9% |
| Vietnamese | 0.0 /100 | #324 | Tragic 96.8% |
| Dominicans | 0.0 /100 | #325 | Tragic 96.8% |
| Indonesians | 0.0 /100 | #326 | Tragic 96.8% |
| Mexicans | 0.0 /100 | #327 | Tragic 96.8% |
Demographics Similar to Immigrants from Congo by Nursery School
In terms of nursery school, the demographic groups most similar to Immigrants from Congo are Immigrants from Iraq (97.6%, a difference of 0.0%), Immigrants from Asia (97.6%, a difference of 0.0%), Ethiopian (97.6%, a difference of 0.010%), Immigrants from Africa (97.6%, a difference of 0.010%), and Yaqui (97.6%, a difference of 0.010%).
| Demographics | Rating | Rank | Nursery School |
| Immigrants | Middle Africa | 0.9 /100 | #247 | Tragic 97.6% |
| Indians (Asian) | 0.9 /100 | #248 | Tragic 97.6% |
| Immigrants | Eastern Africa | 0.9 /100 | #249 | Tragic 97.6% |
| Immigrants | Senegal | 0.9 /100 | #250 | Tragic 97.6% |
| Ethiopians | 0.8 /100 | #251 | Tragic 97.6% |
| Immigrants | Africa | 0.8 /100 | #252 | Tragic 97.6% |
| Immigrants | Iraq | 0.7 /100 | #253 | Tragic 97.6% |
| Immigrants | Congo | 0.7 /100 | #254 | Tragic 97.6% |
| Immigrants | Asia | 0.7 /100 | #255 | Tragic 97.6% |
| Yaqui | 0.6 /100 | #256 | Tragic 97.6% |
| Immigrants | Colombia | 0.6 /100 | #257 | Tragic 97.6% |
| Jamaicans | 0.6 /100 | #258 | Tragic 97.6% |
| Armenians | 0.4 /100 | #259 | Tragic 97.6% |
| Immigrants | South America | 0.4 /100 | #260 | Tragic 97.6% |
| Cubans | 0.4 /100 | #261 | Tragic 97.6% |