Immigrants from Burma/Myanmar vs Immigrants from Congo Associate's Degree
COMPARE
Immigrants from Burma/Myanmar
Immigrants from Congo
Associate's Degree
Associate's Degree Comparison
Immigrants from Burma/Myanmar
Immigrants from Congo
43.7%
ASSOCIATE'S DEGREE
4.3/ 100
METRIC RATING
226th/ 347
METRIC RANK
41.8%
ASSOCIATE'S DEGREE
0.5/ 100
METRIC RATING
256th/ 347
METRIC RANK
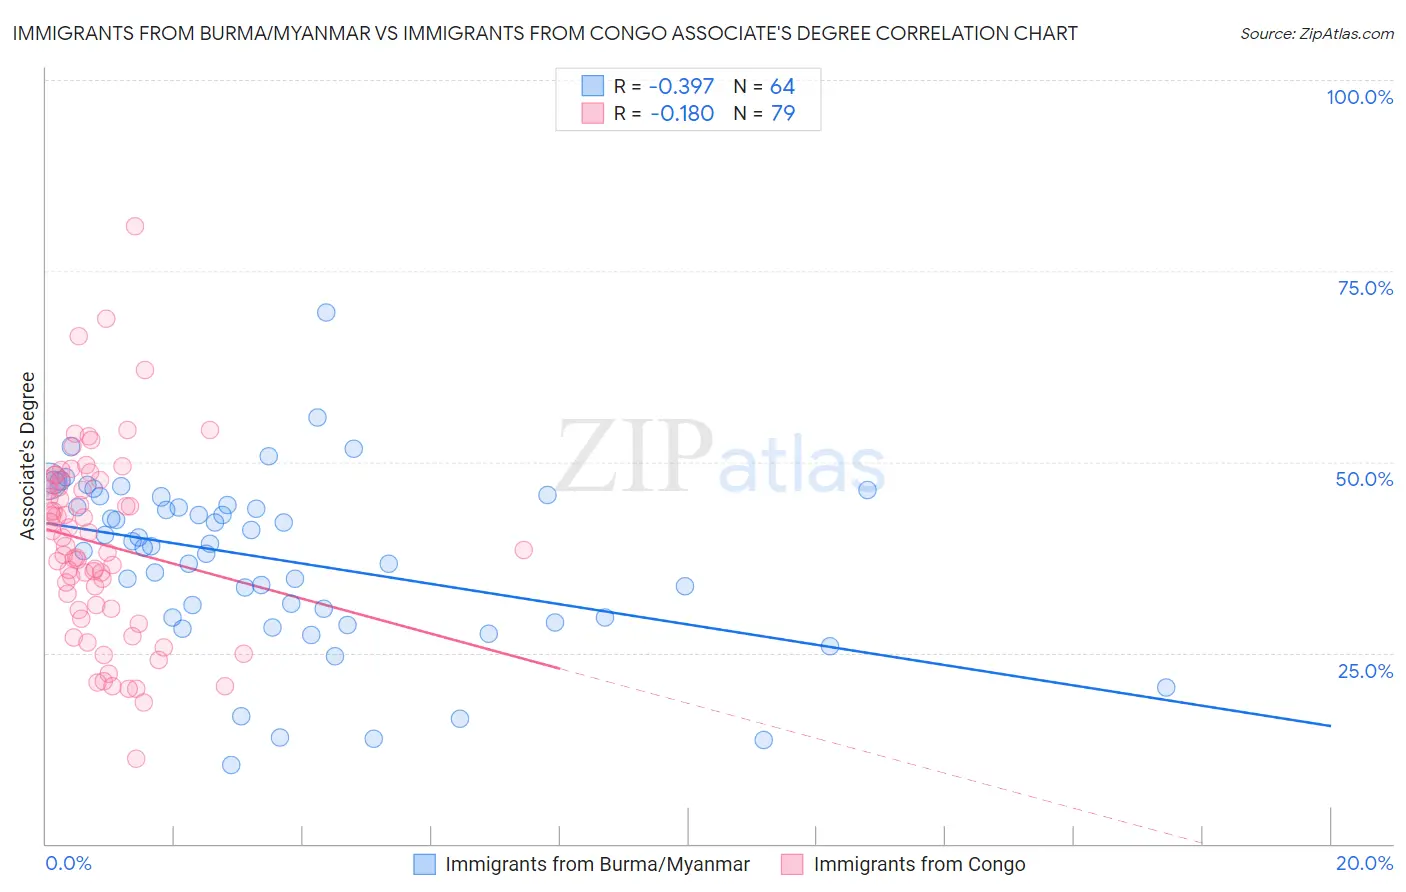
Immigrants from Burma/Myanmar vs Immigrants from Congo Associate's Degree Correlation Chart
The statistical analysis conducted on geographies consisting of 172,341,560 people shows a mild negative correlation between the proportion of Immigrants from Burma/Myanmar and percentage of population with at least associate's degree education in the United States with a correlation coefficient (R) of -0.397 and weighted average of 43.7%. Similarly, the statistical analysis conducted on geographies consisting of 92,128,730 people shows a poor negative correlation between the proportion of Immigrants from Congo and percentage of population with at least associate's degree education in the United States with a correlation coefficient (R) of -0.180 and weighted average of 41.8%, a difference of 4.5%.
Associate's Degree Correlation Summary
| Measurement | Immigrants from Burma/Myanmar | Immigrants from Congo |
| Minimum | 10.2% | 11.1% |
| Maximum | 69.5% | 80.9% |
| Range | 59.3% | 69.7% |
| Mean | 37.2% | 39.3% |
| Median | 39.1% | 39.0% |
| Interquartile 25% (IQ1) | 29.7% | 30.7% |
| Interquartile 75% (IQ3) | 44.9% | 47.3% |
| Interquartile Range (IQR) | 15.2% | 16.6% |
| Standard Deviation (Sample) | 11.3% | 12.3% |
| Standard Deviation (Population) | 11.2% | 12.2% |
Similar Demographics by Associate's Degree
Demographics Similar to Immigrants from Burma/Myanmar by Associate's Degree
In terms of associate's degree, the demographic groups most similar to Immigrants from Burma/Myanmar are Trinidadian and Tobagonian (43.6%, a difference of 0.17%), Guamanian/Chamorro (43.8%, a difference of 0.22%), West Indian (43.8%, a difference of 0.37%), Subsaharan African (43.9%, a difference of 0.51%), and Barbadian (43.9%, a difference of 0.61%).
| Demographics | Rating | Rank | Associate's Degree |
| Whites/Caucasians | 7.5 /100 | #219 | Tragic 44.2% |
| Portuguese | 7.2 /100 | #220 | Tragic 44.1% |
| Immigrants | Western Africa | 6.6 /100 | #221 | Tragic 44.1% |
| Barbadians | 5.8 /100 | #222 | Tragic 43.9% |
| Sub-Saharan Africans | 5.5 /100 | #223 | Tragic 43.9% |
| West Indians | 5.2 /100 | #224 | Tragic 43.8% |
| Guamanians/Chamorros | 4.8 /100 | #225 | Tragic 43.8% |
| Immigrants | Burma/Myanmar | 4.3 /100 | #226 | Tragic 43.7% |
| Trinidadians and Tobagonians | 4.0 /100 | #227 | Tragic 43.6% |
| Hmong | 3.2 /100 | #228 | Tragic 43.4% |
| Immigrants | Trinidad and Tobago | 3.0 /100 | #229 | Tragic 43.3% |
| Immigrants | Barbados | 2.9 /100 | #230 | Tragic 43.3% |
| Liberians | 2.9 /100 | #231 | Tragic 43.3% |
| Native Hawaiians | 2.3 /100 | #232 | Tragic 43.1% |
| Tongans | 2.2 /100 | #233 | Tragic 43.0% |
Demographics Similar to Immigrants from Congo by Associate's Degree
In terms of associate's degree, the demographic groups most similar to Immigrants from Congo are Spanish American (41.8%, a difference of 0.060%), Immigrants from Guyana (41.8%, a difference of 0.12%), Cuban (41.9%, a difference of 0.21%), Japanese (41.7%, a difference of 0.27%), and Indonesian (41.9%, a difference of 0.28%).
| Demographics | Rating | Rank | Associate's Degree |
| Jamaicans | 0.7 /100 | #249 | Tragic 42.1% |
| U.S. Virgin Islanders | 0.7 /100 | #250 | Tragic 42.1% |
| Immigrants | Bahamas | 0.7 /100 | #251 | Tragic 42.1% |
| French American Indians | 0.6 /100 | #252 | Tragic 42.0% |
| Indonesians | 0.6 /100 | #253 | Tragic 41.9% |
| Cubans | 0.6 /100 | #254 | Tragic 41.9% |
| Immigrants | Guyana | 0.5 /100 | #255 | Tragic 41.8% |
| Immigrants | Congo | 0.5 /100 | #256 | Tragic 41.8% |
| Spanish Americans | 0.5 /100 | #257 | Tragic 41.8% |
| Japanese | 0.5 /100 | #258 | Tragic 41.7% |
| Malaysians | 0.4 /100 | #259 | Tragic 41.6% |
| Marshallese | 0.4 /100 | #260 | Tragic 41.6% |
| Nicaraguans | 0.4 /100 | #261 | Tragic 41.5% |
| Bahamians | 0.4 /100 | #262 | Tragic 41.5% |
| Immigrants | Jamaica | 0.3 /100 | #263 | Tragic 41.5% |