Somali vs Immigrants from Congo Family Poverty
COMPARE
Somali
Immigrants from Congo
Family Poverty
Family Poverty Comparison
Somalis
Immigrants from Congo
11.2%
FAMILY POVERTY
0.1/ 100
METRIC RATING
273rd/ 347
METRIC RANK
11.9%
FAMILY POVERTY
0.0/ 100
METRIC RATING
307th/ 347
METRIC RANK
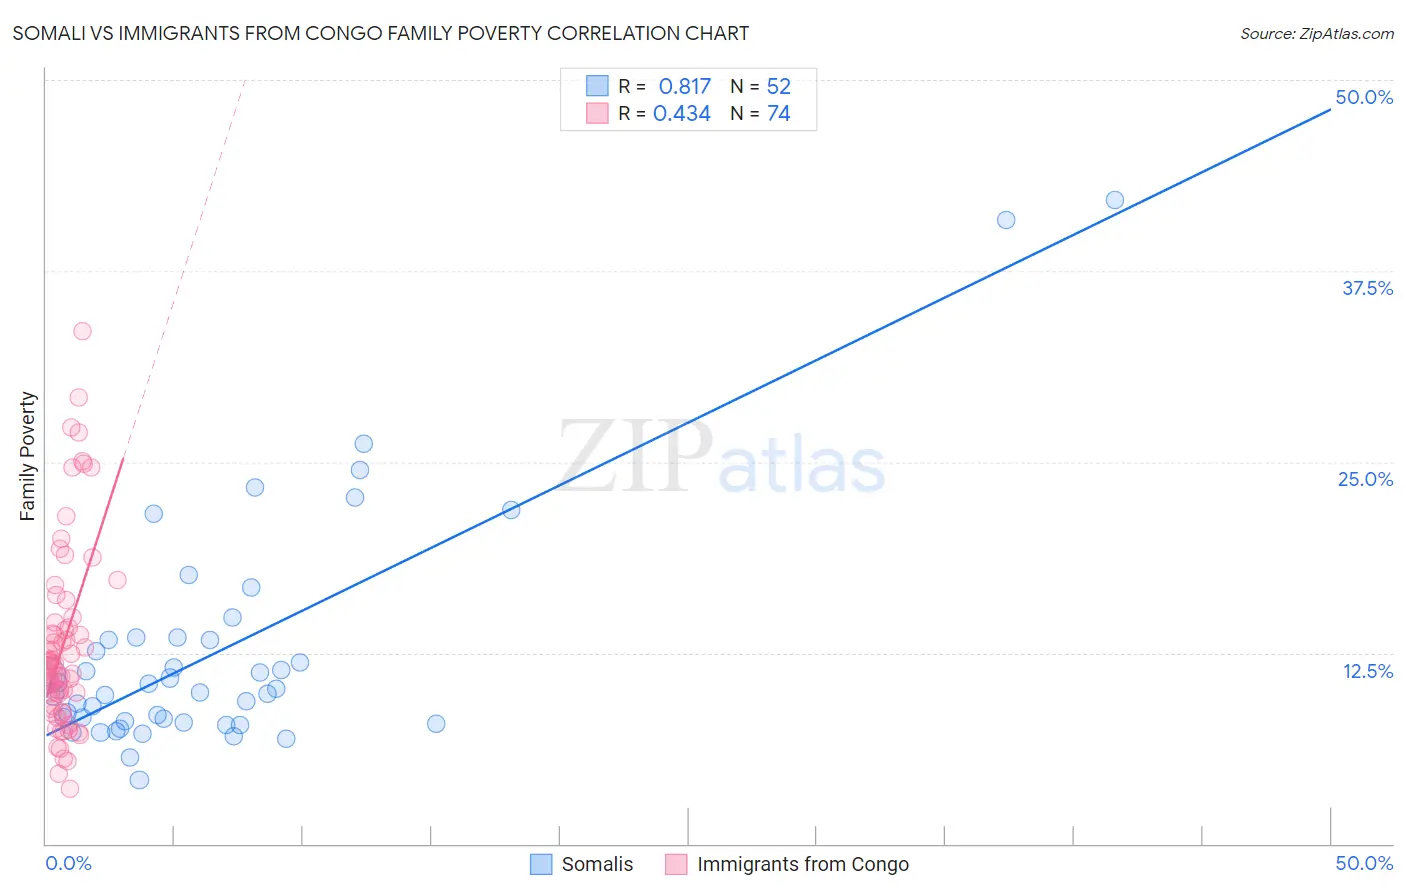
Somali vs Immigrants from Congo Family Poverty Correlation Chart
The statistical analysis conducted on geographies consisting of 99,253,282 people shows a very strong positive correlation between the proportion of Somalis and poverty level among families in the United States with a correlation coefficient (R) of 0.817 and weighted average of 11.2%. Similarly, the statistical analysis conducted on geographies consisting of 92,062,434 people shows a moderate positive correlation between the proportion of Immigrants from Congo and poverty level among families in the United States with a correlation coefficient (R) of 0.434 and weighted average of 11.9%, a difference of 6.1%.
Family Poverty Correlation Summary
| Measurement | Somali | Immigrants from Congo |
| Minimum | 4.2% | 3.6% |
| Maximum | 42.2% | 33.5% |
| Range | 38.0% | 29.9% |
| Mean | 12.6% | 13.1% |
| Median | 10.0% | 11.6% |
| Interquartile 25% (IQ1) | 8.0% | 9.0% |
| Interquartile 75% (IQ3) | 13.4% | 14.5% |
| Interquartile Range (IQR) | 5.5% | 5.5% |
| Standard Deviation (Sample) | 7.7% | 6.1% |
| Standard Deviation (Population) | 7.7% | 6.1% |
Similar Demographics by Family Poverty
Demographics Similar to Somalis by Family Poverty
In terms of family poverty, the demographic groups most similar to Somalis are Spanish American (11.2%, a difference of 0.090%), Central American (11.2%, a difference of 0.13%), Immigrants from Guyana (11.2%, a difference of 0.16%), Chippewa (11.2%, a difference of 0.25%), and Guyanese (11.2%, a difference of 0.28%).
| Demographics | Rating | Rank | Family Poverty |
| Immigrants | El Salvador | 0.1 /100 | #266 | Tragic 11.0% |
| Comanche | 0.1 /100 | #267 | Tragic 11.0% |
| Jamaicans | 0.1 /100 | #268 | Tragic 11.1% |
| Immigrants | Ecuador | 0.1 /100 | #269 | Tragic 11.1% |
| Immigrants | Nicaragua | 0.1 /100 | #270 | Tragic 11.1% |
| Immigrants | Bahamas | 0.1 /100 | #271 | Tragic 11.1% |
| Immigrants | Jamaica | 0.1 /100 | #272 | Tragic 11.2% |
| Somalis | 0.1 /100 | #273 | Tragic 11.2% |
| Spanish Americans | 0.1 /100 | #274 | Tragic 11.2% |
| Central Americans | 0.1 /100 | #275 | Tragic 11.2% |
| Immigrants | Guyana | 0.1 /100 | #276 | Tragic 11.2% |
| Chippewa | 0.1 /100 | #277 | Tragic 11.2% |
| Guyanese | 0.1 /100 | #278 | Tragic 11.2% |
| Blackfeet | 0.0 /100 | #279 | Tragic 11.3% |
| Belizeans | 0.0 /100 | #280 | Tragic 11.3% |
Demographics Similar to Immigrants from Congo by Family Poverty
In terms of family poverty, the demographic groups most similar to Immigrants from Congo are Seminole (11.9%, a difference of 0.060%), Cajun (11.9%, a difference of 0.11%), Hispanic or Latino (12.0%, a difference of 0.50%), Immigrants from Guatemala (12.0%, a difference of 0.51%), and Mexican (11.8%, a difference of 0.67%).
| Demographics | Rating | Rank | Family Poverty |
| Immigrants | Bangladesh | 0.0 /100 | #300 | Tragic 11.7% |
| Bahamians | 0.0 /100 | #301 | Tragic 11.7% |
| Guatemalans | 0.0 /100 | #302 | Tragic 11.7% |
| Africans | 0.0 /100 | #303 | Tragic 11.8% |
| Immigrants | Latin America | 0.0 /100 | #304 | Tragic 11.8% |
| Mexicans | 0.0 /100 | #305 | Tragic 11.8% |
| Cajuns | 0.0 /100 | #306 | Tragic 11.9% |
| Immigrants | Congo | 0.0 /100 | #307 | Tragic 11.9% |
| Seminole | 0.0 /100 | #308 | Tragic 11.9% |
| Hispanics or Latinos | 0.0 /100 | #309 | Tragic 12.0% |
| Immigrants | Guatemala | 0.0 /100 | #310 | Tragic 12.0% |
| Ute | 0.0 /100 | #311 | Tragic 12.1% |
| Immigrants | Central America | 0.0 /100 | #312 | Tragic 12.1% |
| Immigrants | Caribbean | 0.0 /100 | #313 | Tragic 12.2% |
| Kiowa | 0.0 /100 | #314 | Tragic 12.2% |