Immigrants from Brazil vs Norwegian Unemployment Among Ages 16 to 19 years
COMPARE
Immigrants from Brazil
Norwegian
Unemployment Among Ages 16 to 19 years
Unemployment Among Ages 16 to 19 years Comparison
Immigrants from Brazil
Norwegians
17.0%
UNEMPLOYMENT AMONG AGES 16 TO 19 YEARS
94.2/ 100
METRIC RATING
107th/ 347
METRIC RANK
14.5%
UNEMPLOYMENT AMONG AGES 16 TO 19 YEARS
100.0/ 100
METRIC RATING
1st/ 347
METRIC RANK
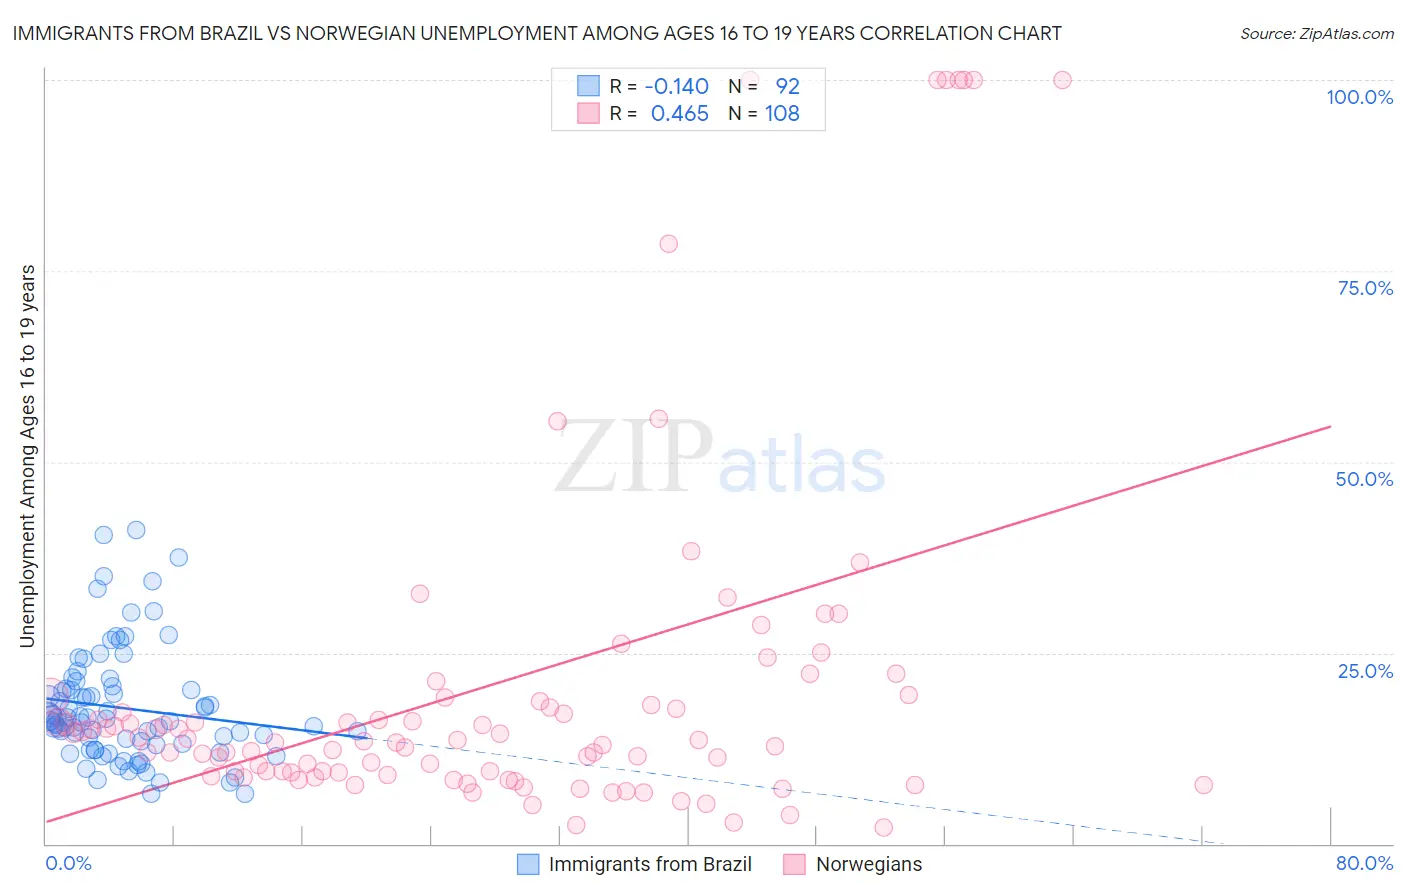
Immigrants from Brazil vs Norwegian Unemployment Among Ages 16 to 19 years Correlation Chart
The statistical analysis conducted on geographies consisting of 327,752,202 people shows a poor negative correlation between the proportion of Immigrants from Brazil and unemployment rate among population between the ages 16 and 19 in the United States with a correlation coefficient (R) of -0.140 and weighted average of 17.0%. Similarly, the statistical analysis conducted on geographies consisting of 482,240,820 people shows a moderate positive correlation between the proportion of Norwegians and unemployment rate among population between the ages 16 and 19 in the United States with a correlation coefficient (R) of 0.465 and weighted average of 14.5%, a difference of 17.1%.
Unemployment Among Ages 16 to 19 years Correlation Summary
| Measurement | Immigrants from Brazil | Norwegian |
| Minimum | 6.6% | 2.1% |
| Maximum | 41.1% | 100.0% |
| Range | 34.5% | 97.9% |
| Mean | 17.8% | 20.8% |
| Median | 16.0% | 13.5% |
| Interquartile 25% (IQ1) | 13.1% | 9.3% |
| Interquartile 75% (IQ3) | 20.3% | 18.4% |
| Interquartile Range (IQR) | 7.2% | 9.1% |
| Standard Deviation (Sample) | 7.3% | 23.6% |
| Standard Deviation (Population) | 7.3% | 23.5% |
Similar Demographics by Unemployment Among Ages 16 to 19 years
Demographics Similar to Immigrants from Brazil by Unemployment Among Ages 16 to 19 years
In terms of unemployment among ages 16 to 19 years, the demographic groups most similar to Immigrants from Brazil are Malaysian (17.0%, a difference of 0.0%), Iranian (17.0%, a difference of 0.020%), Immigrants from Bulgaria (17.0%, a difference of 0.030%), Estonian (17.0%, a difference of 0.030%), and Immigrants from Netherlands (17.0%, a difference of 0.060%).
| Demographics | Rating | Rank | Unemployment Among Ages 16 to 19 years |
| Immigrants | Thailand | 94.7 /100 | #100 | Exceptional 17.0% |
| Immigrants | Saudi Arabia | 94.7 /100 | #101 | Exceptional 17.0% |
| Immigrants | Pakistan | 94.6 /100 | #102 | Exceptional 17.0% |
| Palestinians | 94.6 /100 | #103 | Exceptional 17.0% |
| Italians | 94.5 /100 | #104 | Exceptional 17.0% |
| Immigrants | Bulgaria | 94.3 /100 | #105 | Exceptional 17.0% |
| Estonians | 94.3 /100 | #106 | Exceptional 17.0% |
| Immigrants | Brazil | 94.2 /100 | #107 | Exceptional 17.0% |
| Malaysians | 94.2 /100 | #108 | Exceptional 17.0% |
| Iranians | 94.1 /100 | #109 | Exceptional 17.0% |
| Immigrants | Netherlands | 93.9 /100 | #110 | Exceptional 17.0% |
| Immigrants | Asia | 93.9 /100 | #111 | Exceptional 17.0% |
| Immigrants | Iraq | 93.7 /100 | #112 | Exceptional 17.0% |
| Icelanders | 93.4 /100 | #113 | Exceptional 17.0% |
| Immigrants | Poland | 93.1 /100 | #114 | Exceptional 17.0% |
Demographics Similar to Norwegians by Unemployment Among Ages 16 to 19 years
In terms of unemployment among ages 16 to 19 years, the demographic groups most similar to Norwegians are Immigrants from India (15.0%, a difference of 3.4%), Luxembourger (15.1%, a difference of 3.8%), Danish (15.2%, a difference of 4.6%), Immigrants from Somalia (15.3%, a difference of 5.2%), and Swedish (15.3%, a difference of 5.5%).
| Demographics | Rating | Rank | Unemployment Among Ages 16 to 19 years |
| Norwegians | 100.0 /100 | #1 | Exceptional 14.5% |
| Immigrants | India | 100.0 /100 | #2 | Exceptional 15.0% |
| Luxembourgers | 100.0 /100 | #3 | Exceptional 15.1% |
| Danes | 100.0 /100 | #4 | Exceptional 15.2% |
| Immigrants | Somalia | 100.0 /100 | #5 | Exceptional 15.3% |
| Swedes | 100.0 /100 | #6 | Exceptional 15.3% |
| Immigrants | Bosnia and Herzegovina | 100.0 /100 | #7 | Exceptional 15.3% |
| Czechs | 100.0 /100 | #8 | Exceptional 15.4% |
| Scandinavians | 100.0 /100 | #9 | Exceptional 15.4% |
| Zimbabweans | 100.0 /100 | #10 | Exceptional 15.4% |
| Indonesians | 100.0 /100 | #11 | Exceptional 15.5% |
| Taiwanese | 100.0 /100 | #12 | Exceptional 15.5% |
| Immigrants | Burma/Myanmar | 100.0 /100 | #13 | Exceptional 15.6% |
| Immigrants | Zaire | 100.0 /100 | #14 | Exceptional 15.6% |
| Yugoslavians | 100.0 /100 | #15 | Exceptional 15.6% |