Austrian vs Korean Poverty
COMPARE
Austrian
Korean
Poverty
Poverty Comparison
Austrians
Koreans
11.2%
POVERTY
97.8/ 100
METRIC RATING
62nd/ 347
METRIC RANK
10.9%
POVERTY
99.2/ 100
METRIC RATING
42nd/ 347
METRIC RANK
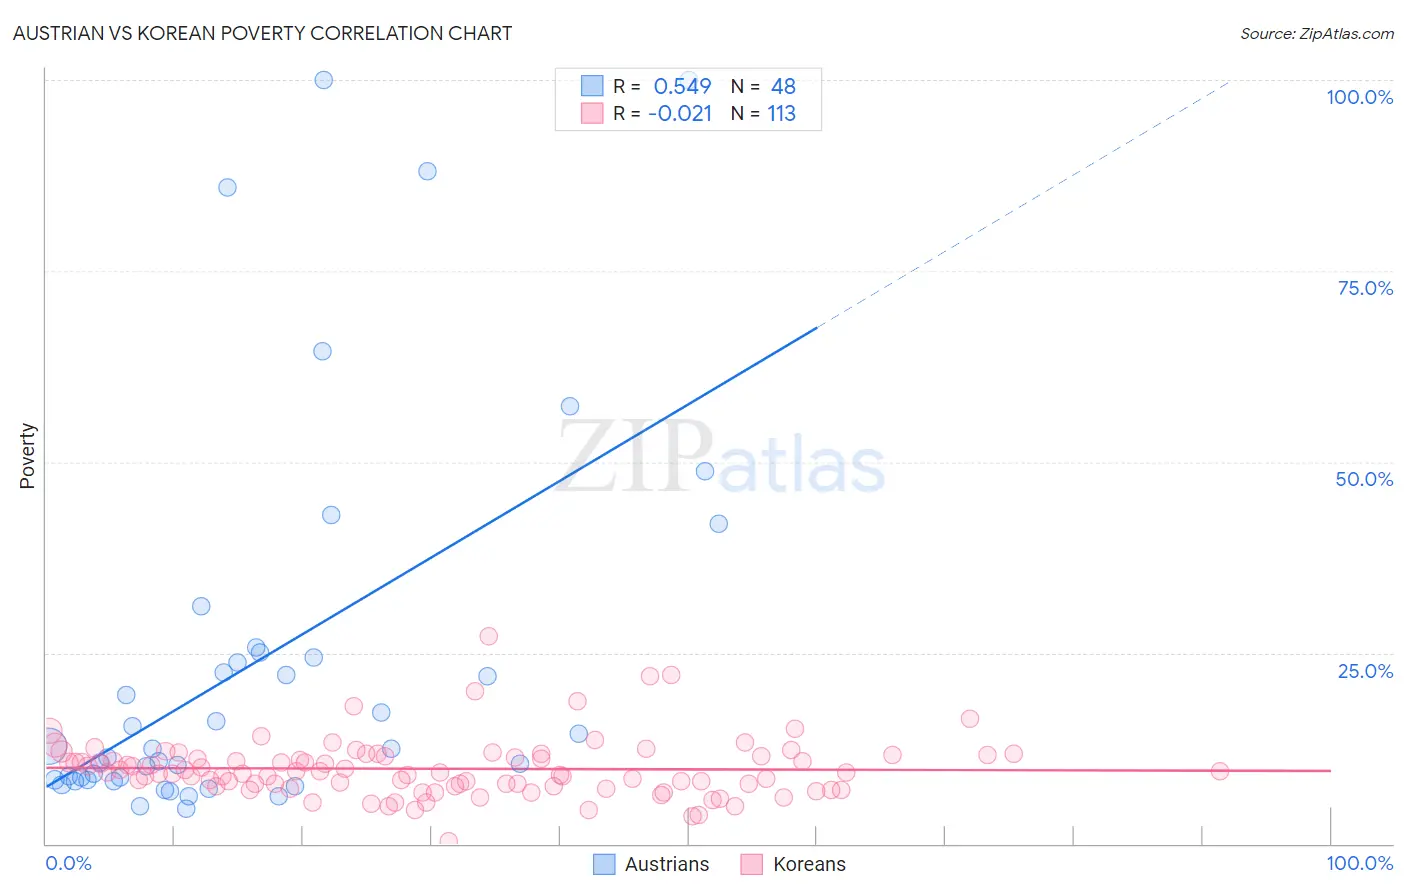
Austrian vs Korean Poverty Correlation Chart
The statistical analysis conducted on geographies consisting of 451,775,249 people shows a substantial positive correlation between the proportion of Austrians and poverty level in the United States with a correlation coefficient (R) of 0.549 and weighted average of 11.2%. Similarly, the statistical analysis conducted on geographies consisting of 510,388,718 people shows no correlation between the proportion of Koreans and poverty level in the United States with a correlation coefficient (R) of -0.021 and weighted average of 10.9%, a difference of 2.7%.
Poverty Correlation Summary
| Measurement | Austrian | Korean |
| Minimum | 4.6% | 0.27% |
| Maximum | 100.0% | 27.2% |
| Range | 95.4% | 27.0% |
| Mean | 23.7% | 9.8% |
| Median | 12.5% | 9.3% |
| Interquartile 25% (IQ1) | 8.4% | 7.5% |
| Interquartile 75% (IQ3) | 24.7% | 11.6% |
| Interquartile Range (IQR) | 16.3% | 4.0% |
| Standard Deviation (Sample) | 25.3% | 3.9% |
| Standard Deviation (Population) | 25.0% | 3.8% |
Demographics Similar to Austrians and Koreans by Poverty
In terms of poverty, the demographic groups most similar to Austrians are Immigrants from Italy (11.2%, a difference of 0.030%), Immigrants from Sri Lanka (11.2%, a difference of 0.10%), Immigrants from Europe (11.2%, a difference of 0.26%), German (11.1%, a difference of 0.41%), and Scandinavian (11.1%, a difference of 0.47%). Similarly, the demographic groups most similar to Koreans are Immigrants from Singapore (10.9%, a difference of 0.050%), Immigrants from Moldova (10.9%, a difference of 0.19%), Turkish (11.0%, a difference of 0.70%), Immigrants from Czechoslovakia (11.0%, a difference of 0.79%), and Immigrants from Romania (11.0%, a difference of 0.80%).
| Demographics | Rating | Rank | Poverty |
| Koreans | 99.2 /100 | #42 | Exceptional 10.9% |
| Immigrants | Singapore | 99.2 /100 | #43 | Exceptional 10.9% |
| Immigrants | Moldova | 99.1 /100 | #44 | Exceptional 10.9% |
| Turks | 98.9 /100 | #45 | Exceptional 11.0% |
| Immigrants | Czechoslovakia | 98.9 /100 | #46 | Exceptional 11.0% |
| Immigrants | Romania | 98.9 /100 | #47 | Exceptional 11.0% |
| Slovenes | 98.9 /100 | #48 | Exceptional 11.0% |
| Immigrants | Japan | 98.9 /100 | #49 | Exceptional 11.0% |
| Asians | 98.9 /100 | #50 | Exceptional 11.0% |
| Immigrants | Croatia | 98.7 /100 | #51 | Exceptional 11.0% |
| Immigrants | Philippines | 98.7 /100 | #52 | Exceptional 11.0% |
| Immigrants | Austria | 98.6 /100 | #53 | Exceptional 11.1% |
| Immigrants | Bulgaria | 98.5 /100 | #54 | Exceptional 11.1% |
| Immigrants | Serbia | 98.5 /100 | #55 | Exceptional 11.1% |
| Estonians | 98.2 /100 | #56 | Exceptional 11.1% |
| Scandinavians | 98.2 /100 | #57 | Exceptional 11.1% |
| Germans | 98.1 /100 | #58 | Exceptional 11.1% |
| Immigrants | Europe | 98.0 /100 | #59 | Exceptional 11.2% |
| Immigrants | Sri Lanka | 97.9 /100 | #60 | Exceptional 11.2% |
| Immigrants | Italy | 97.9 /100 | #61 | Exceptional 11.2% |
| Austrians | 97.8 /100 | #62 | Exceptional 11.2% |