Immigrants from England vs Korean Poverty
COMPARE
Immigrants from England
Korean
Poverty
Poverty Comparison
Immigrants from England
Koreans
11.4%
POVERTY
96.2/ 100
METRIC RATING
85th/ 347
METRIC RANK
10.9%
POVERTY
99.2/ 100
METRIC RATING
42nd/ 347
METRIC RANK
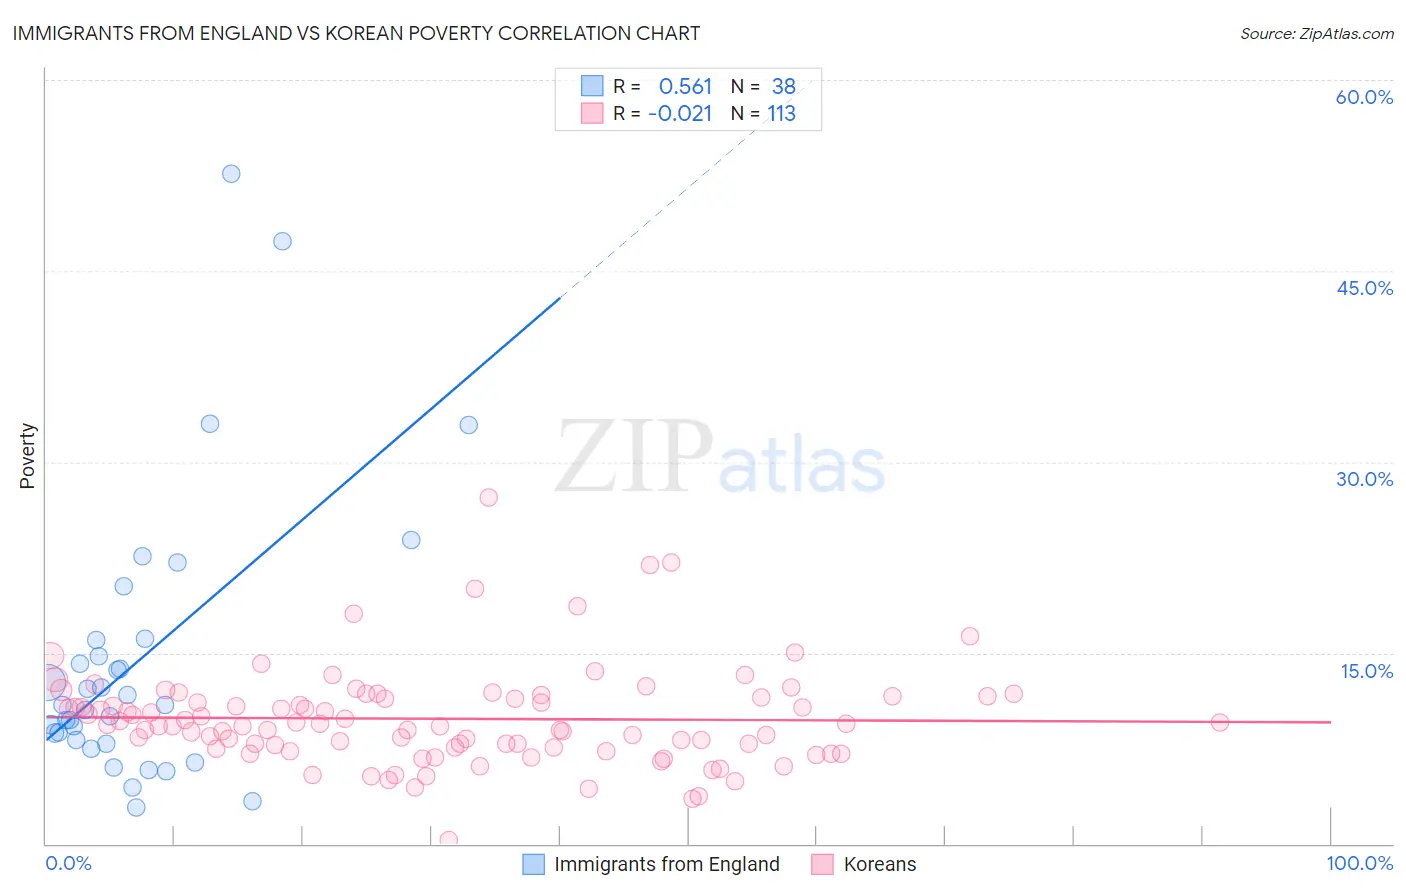
Immigrants from England vs Korean Poverty Correlation Chart
The statistical analysis conducted on geographies consisting of 391,749,071 people shows a substantial positive correlation between the proportion of Immigrants from England and poverty level in the United States with a correlation coefficient (R) of 0.561 and weighted average of 11.4%. Similarly, the statistical analysis conducted on geographies consisting of 510,388,718 people shows no correlation between the proportion of Koreans and poverty level in the United States with a correlation coefficient (R) of -0.021 and weighted average of 10.9%, a difference of 4.3%.
Poverty Correlation Summary
| Measurement | Immigrants from England | Korean |
| Minimum | 2.8% | 0.27% |
| Maximum | 52.7% | 27.2% |
| Range | 49.8% | 27.0% |
| Mean | 14.4% | 9.8% |
| Median | 10.9% | 9.3% |
| Interquartile 25% (IQ1) | 8.2% | 7.5% |
| Interquartile 75% (IQ3) | 16.0% | 11.6% |
| Interquartile Range (IQR) | 7.8% | 4.0% |
| Standard Deviation (Sample) | 11.0% | 3.9% |
| Standard Deviation (Population) | 10.9% | 3.8% |
Similar Demographics by Poverty
Demographics Similar to Immigrants from England by Poverty
In terms of poverty, the demographic groups most similar to Immigrants from England are English (11.3%, a difference of 0.070%), Immigrants from Sweden (11.3%, a difference of 0.080%), Jordanian (11.4%, a difference of 0.12%), Northern European (11.4%, a difference of 0.12%), and Egyptian (11.3%, a difference of 0.25%).
| Demographics | Rating | Rank | Poverty |
| Dutch | 96.7 /100 | #78 | Exceptional 11.3% |
| Cambodians | 96.7 /100 | #79 | Exceptional 11.3% |
| Indians (Asian) | 96.6 /100 | #80 | Exceptional 11.3% |
| Irish | 96.6 /100 | #81 | Exceptional 11.3% |
| Egyptians | 96.5 /100 | #82 | Exceptional 11.3% |
| Immigrants | Sweden | 96.3 /100 | #83 | Exceptional 11.3% |
| English | 96.3 /100 | #84 | Exceptional 11.3% |
| Immigrants | England | 96.2 /100 | #85 | Exceptional 11.4% |
| Jordanians | 96.0 /100 | #86 | Exceptional 11.4% |
| Northern Europeans | 96.0 /100 | #87 | Exceptional 11.4% |
| Belgians | 95.8 /100 | #88 | Exceptional 11.4% |
| Czechoslovakians | 95.7 /100 | #89 | Exceptional 11.4% |
| Immigrants | Denmark | 95.5 /100 | #90 | Exceptional 11.4% |
| Finns | 95.2 /100 | #91 | Exceptional 11.4% |
| British | 95.0 /100 | #92 | Exceptional 11.4% |
Demographics Similar to Koreans by Poverty
In terms of poverty, the demographic groups most similar to Koreans are Immigrants from Singapore (10.9%, a difference of 0.050%), Immigrants from Moldova (10.9%, a difference of 0.19%), Immigrants from Iran (10.9%, a difference of 0.22%), Russian (10.9%, a difference of 0.31%), and Immigrants from Pakistan (10.8%, a difference of 0.36%).
| Demographics | Rating | Rank | Poverty |
| Tongans | 99.4 /100 | #35 | Exceptional 10.8% |
| Cypriots | 99.3 /100 | #36 | Exceptional 10.8% |
| Immigrants | Greece | 99.3 /100 | #37 | Exceptional 10.8% |
| Czechs | 99.3 /100 | #38 | Exceptional 10.8% |
| Immigrants | Pakistan | 99.3 /100 | #39 | Exceptional 10.8% |
| Russians | 99.3 /100 | #40 | Exceptional 10.9% |
| Immigrants | Iran | 99.2 /100 | #41 | Exceptional 10.9% |
| Koreans | 99.2 /100 | #42 | Exceptional 10.9% |
| Immigrants | Singapore | 99.2 /100 | #43 | Exceptional 10.9% |
| Immigrants | Moldova | 99.1 /100 | #44 | Exceptional 10.9% |
| Turks | 98.9 /100 | #45 | Exceptional 11.0% |
| Immigrants | Czechoslovakia | 98.9 /100 | #46 | Exceptional 11.0% |
| Immigrants | Romania | 98.9 /100 | #47 | Exceptional 11.0% |
| Slovenes | 98.9 /100 | #48 | Exceptional 11.0% |
| Immigrants | Japan | 98.9 /100 | #49 | Exceptional 11.0% |