South African vs Korean Poverty
COMPARE
South African
Korean
Poverty
Poverty Comparison
South Africans
Koreans
11.7%
POVERTY
87.0/ 100
METRIC RATING
129th/ 347
METRIC RANK
10.9%
POVERTY
99.2/ 100
METRIC RATING
42nd/ 347
METRIC RANK
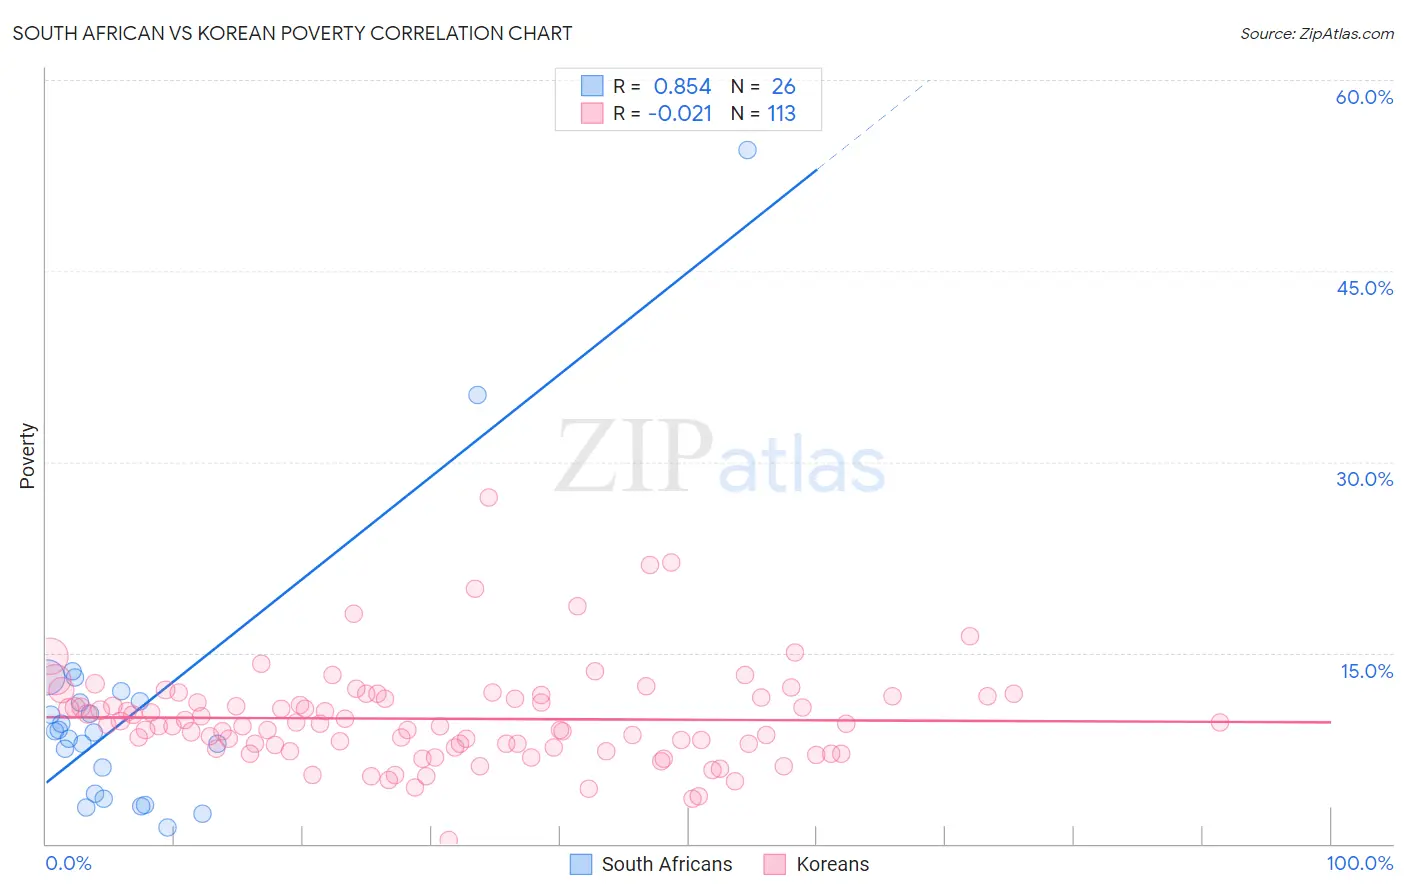
South African vs Korean Poverty Correlation Chart
The statistical analysis conducted on geographies consisting of 182,558,592 people shows a very strong positive correlation between the proportion of South Africans and poverty level in the United States with a correlation coefficient (R) of 0.854 and weighted average of 11.7%. Similarly, the statistical analysis conducted on geographies consisting of 510,388,718 people shows no correlation between the proportion of Koreans and poverty level in the United States with a correlation coefficient (R) of -0.021 and weighted average of 10.9%, a difference of 7.9%.
Poverty Correlation Summary
| Measurement | South African | Korean |
| Minimum | 1.3% | 0.27% |
| Maximum | 54.5% | 27.2% |
| Range | 53.2% | 27.0% |
| Mean | 10.7% | 9.8% |
| Median | 8.8% | 9.3% |
| Interquartile 25% (IQ1) | 3.9% | 7.5% |
| Interquartile 75% (IQ3) | 11.2% | 11.6% |
| Interquartile Range (IQR) | 7.2% | 4.0% |
| Standard Deviation (Sample) | 11.0% | 3.9% |
| Standard Deviation (Population) | 10.8% | 3.8% |
Similar Demographics by Poverty
Demographics Similar to South Africans by Poverty
In terms of poverty, the demographic groups most similar to South Africans are Immigrants from Israel (11.7%, a difference of 0.090%), Immigrants from Ukraine (11.8%, a difference of 0.090%), French (11.8%, a difference of 0.19%), Immigrants from Argentina (11.7%, a difference of 0.22%), and Immigrants from Norway (11.7%, a difference of 0.24%).
| Demographics | Rating | Rank | Poverty |
| Puget Sound Salish | 88.7 /100 | #122 | Excellent 11.7% |
| Immigrants | Hungary | 88.6 /100 | #123 | Excellent 11.7% |
| Soviet Union | 88.4 /100 | #124 | Excellent 11.7% |
| Immigrants | Brazil | 88.2 /100 | #125 | Excellent 11.7% |
| Immigrants | Norway | 88.0 /100 | #126 | Excellent 11.7% |
| Immigrants | Argentina | 88.0 /100 | #127 | Excellent 11.7% |
| Immigrants | Israel | 87.4 /100 | #128 | Excellent 11.7% |
| South Africans | 87.0 /100 | #129 | Excellent 11.7% |
| Immigrants | Ukraine | 86.6 /100 | #130 | Excellent 11.8% |
| French | 86.1 /100 | #131 | Excellent 11.8% |
| Peruvians | 85.6 /100 | #132 | Excellent 11.8% |
| Immigrants | Western Europe | 85.2 /100 | #133 | Excellent 11.8% |
| Yugoslavians | 85.2 /100 | #134 | Excellent 11.8% |
| Immigrants | Vietnam | 85.2 /100 | #135 | Excellent 11.8% |
| Chileans | 84.2 /100 | #136 | Excellent 11.8% |
Demographics Similar to Koreans by Poverty
In terms of poverty, the demographic groups most similar to Koreans are Immigrants from Singapore (10.9%, a difference of 0.050%), Immigrants from Moldova (10.9%, a difference of 0.19%), Immigrants from Iran (10.9%, a difference of 0.22%), Russian (10.9%, a difference of 0.31%), and Immigrants from Pakistan (10.8%, a difference of 0.36%).
| Demographics | Rating | Rank | Poverty |
| Tongans | 99.4 /100 | #35 | Exceptional 10.8% |
| Cypriots | 99.3 /100 | #36 | Exceptional 10.8% |
| Immigrants | Greece | 99.3 /100 | #37 | Exceptional 10.8% |
| Czechs | 99.3 /100 | #38 | Exceptional 10.8% |
| Immigrants | Pakistan | 99.3 /100 | #39 | Exceptional 10.8% |
| Russians | 99.3 /100 | #40 | Exceptional 10.9% |
| Immigrants | Iran | 99.2 /100 | #41 | Exceptional 10.9% |
| Koreans | 99.2 /100 | #42 | Exceptional 10.9% |
| Immigrants | Singapore | 99.2 /100 | #43 | Exceptional 10.9% |
| Immigrants | Moldova | 99.1 /100 | #44 | Exceptional 10.9% |
| Turks | 98.9 /100 | #45 | Exceptional 11.0% |
| Immigrants | Czechoslovakia | 98.9 /100 | #46 | Exceptional 11.0% |
| Immigrants | Romania | 98.9 /100 | #47 | Exceptional 11.0% |
| Slovenes | 98.9 /100 | #48 | Exceptional 11.0% |
| Immigrants | Japan | 98.9 /100 | #49 | Exceptional 11.0% |