Syrian vs Korean Poverty
COMPARE
Syrian
Korean
Poverty
Poverty Comparison
Syrians
Koreans
12.0%
POVERTY
75.1/ 100
METRIC RATING
145th/ 347
METRIC RANK
10.9%
POVERTY
99.2/ 100
METRIC RATING
42nd/ 347
METRIC RANK
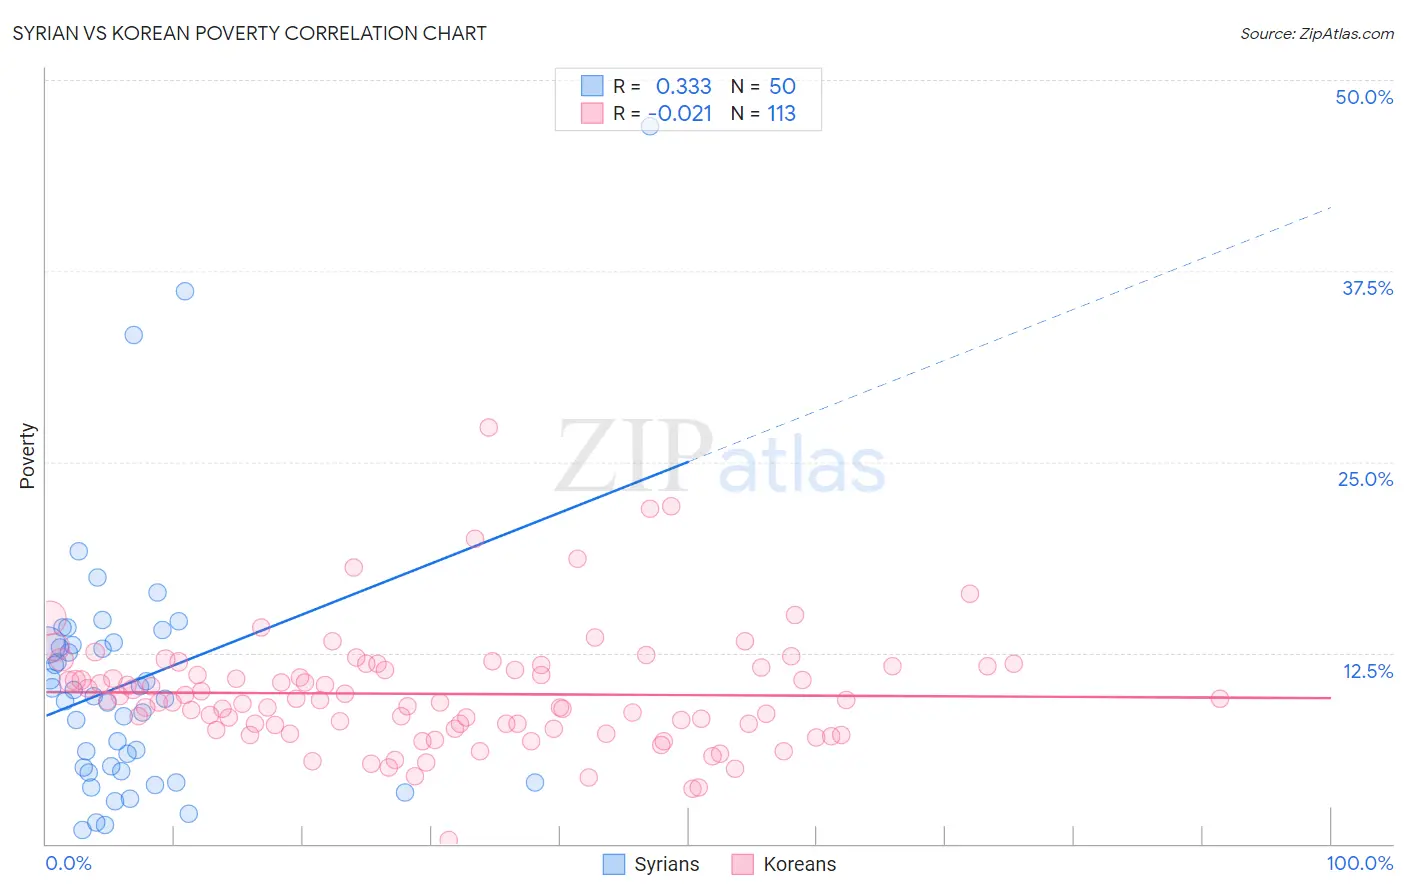
Syrian vs Korean Poverty Correlation Chart
The statistical analysis conducted on geographies consisting of 266,206,750 people shows a mild positive correlation between the proportion of Syrians and poverty level in the United States with a correlation coefficient (R) of 0.333 and weighted average of 12.0%. Similarly, the statistical analysis conducted on geographies consisting of 510,388,718 people shows no correlation between the proportion of Koreans and poverty level in the United States with a correlation coefficient (R) of -0.021 and weighted average of 10.9%, a difference of 10.1%.
Poverty Correlation Summary
| Measurement | Syrian | Korean |
| Minimum | 0.89% | 0.27% |
| Maximum | 47.0% | 27.2% |
| Range | 46.1% | 27.0% |
| Mean | 10.6% | 9.8% |
| Median | 9.6% | 9.3% |
| Interquartile 25% (IQ1) | 4.8% | 7.5% |
| Interquartile 75% (IQ3) | 13.0% | 11.6% |
| Interquartile Range (IQR) | 8.3% | 4.0% |
| Standard Deviation (Sample) | 8.7% | 3.9% |
| Standard Deviation (Population) | 8.6% | 3.8% |
Similar Demographics by Poverty
Demographics Similar to Syrians by Poverty
In terms of poverty, the demographic groups most similar to Syrians are Afghan (12.0%, a difference of 0.030%), Immigrants from Bosnia and Herzegovina (12.0%, a difference of 0.19%), Immigrants from Germany (12.0%, a difference of 0.31%), Immigrants from Malaysia (12.0%, a difference of 0.32%), and Immigrants from Kazakhstan (12.0%, a difference of 0.37%).
| Demographics | Rating | Rank | Poverty |
| Immigrants | Jordan | 82.4 /100 | #138 | Excellent 11.9% |
| Pakistanis | 82.2 /100 | #139 | Excellent 11.9% |
| Immigrants | Peru | 81.1 /100 | #140 | Excellent 11.9% |
| Immigrants | France | 80.5 /100 | #141 | Excellent 11.9% |
| Basques | 80.4 /100 | #142 | Excellent 11.9% |
| Brazilians | 79.7 /100 | #143 | Good 11.9% |
| Icelanders | 77.9 /100 | #144 | Good 11.9% |
| Syrians | 75.1 /100 | #145 | Good 12.0% |
| Afghans | 74.9 /100 | #146 | Good 12.0% |
| Immigrants | Bosnia and Herzegovina | 73.7 /100 | #147 | Good 12.0% |
| Immigrants | Germany | 72.7 /100 | #148 | Good 12.0% |
| Immigrants | Malaysia | 72.7 /100 | #149 | Good 12.0% |
| Immigrants | Kazakhstan | 72.3 /100 | #150 | Good 12.0% |
| Samoans | 71.9 /100 | #151 | Good 12.0% |
| Armenians | 67.6 /100 | #152 | Good 12.1% |
Demographics Similar to Koreans by Poverty
In terms of poverty, the demographic groups most similar to Koreans are Immigrants from Singapore (10.9%, a difference of 0.050%), Immigrants from Moldova (10.9%, a difference of 0.19%), Immigrants from Iran (10.9%, a difference of 0.22%), Russian (10.9%, a difference of 0.31%), and Immigrants from Pakistan (10.8%, a difference of 0.36%).
| Demographics | Rating | Rank | Poverty |
| Tongans | 99.4 /100 | #35 | Exceptional 10.8% |
| Cypriots | 99.3 /100 | #36 | Exceptional 10.8% |
| Immigrants | Greece | 99.3 /100 | #37 | Exceptional 10.8% |
| Czechs | 99.3 /100 | #38 | Exceptional 10.8% |
| Immigrants | Pakistan | 99.3 /100 | #39 | Exceptional 10.8% |
| Russians | 99.3 /100 | #40 | Exceptional 10.9% |
| Immigrants | Iran | 99.2 /100 | #41 | Exceptional 10.9% |
| Koreans | 99.2 /100 | #42 | Exceptional 10.9% |
| Immigrants | Singapore | 99.2 /100 | #43 | Exceptional 10.9% |
| Immigrants | Moldova | 99.1 /100 | #44 | Exceptional 10.9% |
| Turks | 98.9 /100 | #45 | Exceptional 11.0% |
| Immigrants | Czechoslovakia | 98.9 /100 | #46 | Exceptional 11.0% |
| Immigrants | Romania | 98.9 /100 | #47 | Exceptional 11.0% |
| Slovenes | 98.9 /100 | #48 | Exceptional 11.0% |
| Immigrants | Japan | 98.9 /100 | #49 | Exceptional 11.0% |