Immigrants from Belize vs Korean Single Father Poverty
COMPARE
Immigrants from Belize
Korean
Single Father Poverty
Single Father Poverty Comparison
Immigrants from Belize
Koreans
16.5%
SINGLE FATHER POVERTY
19.8/ 100
METRIC RATING
199th/ 347
METRIC RANK
14.0%
SINGLE FATHER POVERTY
100.0/ 100
METRIC RATING
10th/ 347
METRIC RANK
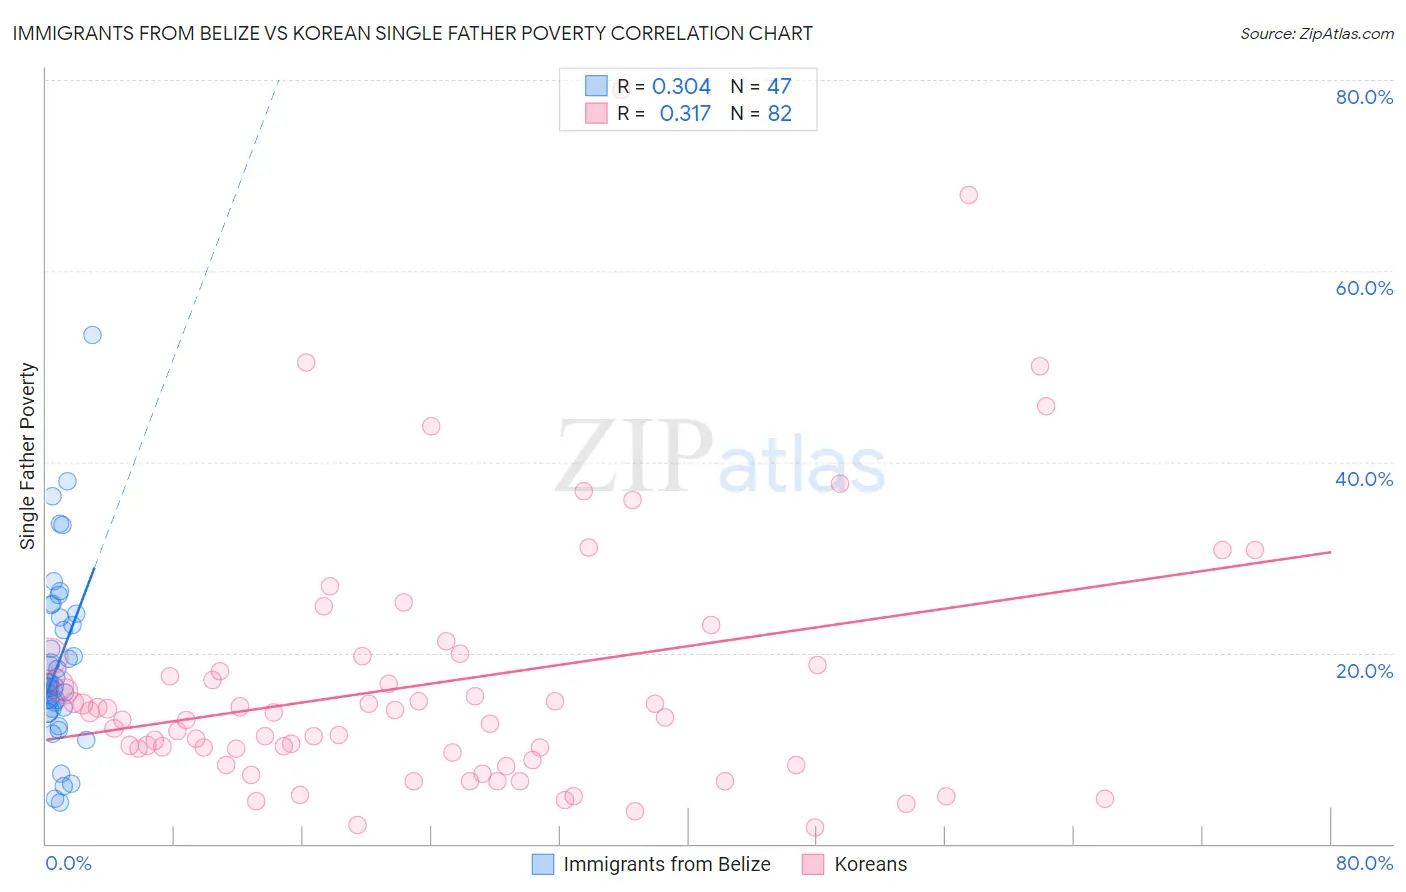
Immigrants from Belize vs Korean Single Father Poverty Correlation Chart
The statistical analysis conducted on geographies consisting of 118,811,167 people shows a mild positive correlation between the proportion of Immigrants from Belize and poverty level among single fathers in the United States with a correlation coefficient (R) of 0.304 and weighted average of 16.5%. Similarly, the statistical analysis conducted on geographies consisting of 383,489,954 people shows a mild positive correlation between the proportion of Koreans and poverty level among single fathers in the United States with a correlation coefficient (R) of 0.317 and weighted average of 14.0%, a difference of 18.4%.
Single Father Poverty Correlation Summary
| Measurement | Immigrants from Belize | Korean |
| Minimum | 4.3% | 1.8% |
| Maximum | 53.3% | 78.9% |
| Range | 49.0% | 77.1% |
| Mean | 18.9% | 16.9% |
| Median | 16.7% | 13.1% |
| Interquartile 25% (IQ1) | 14.1% | 8.8% |
| Interquartile 75% (IQ3) | 23.7% | 18.8% |
| Interquartile Range (IQR) | 9.6% | 9.9% |
| Standard Deviation (Sample) | 9.2% | 14.0% |
| Standard Deviation (Population) | 9.1% | 13.9% |
Similar Demographics by Single Father Poverty
Demographics Similar to Immigrants from Belize by Single Father Poverty
In terms of single father poverty, the demographic groups most similar to Immigrants from Belize are Romanian (16.5%, a difference of 0.020%), Immigrants from Northern Europe (16.5%, a difference of 0.030%), Immigrants from Canada (16.5%, a difference of 0.14%), Syrian (16.6%, a difference of 0.17%), and Cuban (16.6%, a difference of 0.24%).
| Demographics | Rating | Rank | Single Father Poverty |
| Immigrants | Switzerland | 24.8 /100 | #192 | Fair 16.5% |
| Ecuadorians | 24.5 /100 | #193 | Fair 16.5% |
| Cape Verdeans | 24.4 /100 | #194 | Fair 16.5% |
| Immigrants | Barbados | 24.3 /100 | #195 | Fair 16.5% |
| Immigrants | Canada | 21.9 /100 | #196 | Fair 16.5% |
| Immigrants | Northern Europe | 20.3 /100 | #197 | Fair 16.5% |
| Romanians | 20.1 /100 | #198 | Fair 16.5% |
| Immigrants | Belize | 19.8 /100 | #199 | Poor 16.5% |
| Syrians | 17.4 /100 | #200 | Poor 16.6% |
| Cubans | 16.5 /100 | #201 | Poor 16.6% |
| Immigrants | Croatia | 16.5 /100 | #202 | Poor 16.6% |
| Immigrants | North America | 15.1 /100 | #203 | Poor 16.6% |
| Immigrants | Guatemala | 14.8 /100 | #204 | Poor 16.6% |
| Venezuelans | 14.3 /100 | #205 | Poor 16.6% |
| Immigrants | Senegal | 13.7 /100 | #206 | Poor 16.6% |
Demographics Similar to Koreans by Single Father Poverty
In terms of single father poverty, the demographic groups most similar to Koreans are Afghan (14.0%, a difference of 0.10%), Filipino (14.0%, a difference of 0.40%), Immigrants from India (14.0%, a difference of 0.41%), Immigrants from Philippines (14.0%, a difference of 0.55%), and Samoan (13.8%, a difference of 1.2%).
| Demographics | Rating | Rank | Single Father Poverty |
| Tsimshian | 100.0 /100 | #3 | Exceptional 12.7% |
| Immigrants | Fiji | 100.0 /100 | #4 | Exceptional 13.2% |
| Immigrants | Ethiopia | 100.0 /100 | #5 | Exceptional 13.4% |
| Ethiopians | 100.0 /100 | #6 | Exceptional 13.5% |
| Immigrants | Taiwan | 100.0 /100 | #7 | Exceptional 13.7% |
| Samoans | 100.0 /100 | #8 | Exceptional 13.8% |
| Afghans | 100.0 /100 | #9 | Exceptional 14.0% |
| Koreans | 100.0 /100 | #10 | Exceptional 14.0% |
| Filipinos | 100.0 /100 | #11 | Exceptional 14.0% |
| Immigrants | India | 100.0 /100 | #12 | Exceptional 14.0% |
| Immigrants | Philippines | 100.0 /100 | #13 | Exceptional 14.0% |
| Immigrants | Vietnam | 100.0 /100 | #14 | Exceptional 14.1% |
| Sri Lankans | 100.0 /100 | #15 | Exceptional 14.2% |
| Immigrants | Iran | 100.0 /100 | #16 | Exceptional 14.2% |
| Immigrants | Hong Kong | 100.0 /100 | #17 | Exceptional 14.2% |