Colville vs Korean Poverty
COMPARE
Colville
Korean
Poverty
Poverty Comparison
Colville
Koreans
16.6%
POVERTY
0.0/ 100
METRIC RATING
323rd/ 347
METRIC RANK
10.9%
POVERTY
99.2/ 100
METRIC RATING
42nd/ 347
METRIC RANK
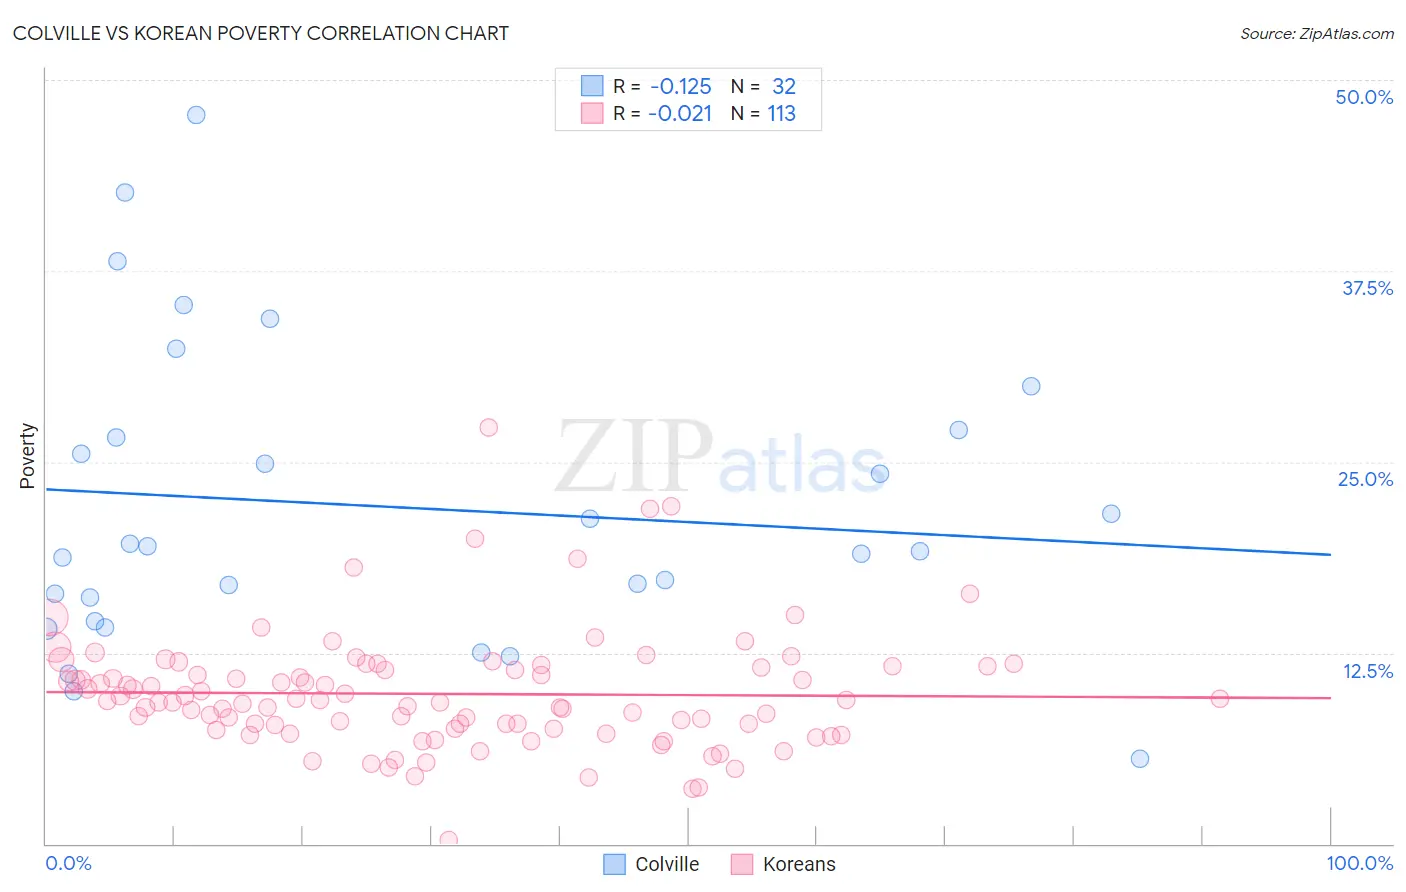
Colville vs Korean Poverty Correlation Chart
The statistical analysis conducted on geographies consisting of 34,683,494 people shows a poor negative correlation between the proportion of Colville and poverty level in the United States with a correlation coefficient (R) of -0.125 and weighted average of 16.6%. Similarly, the statistical analysis conducted on geographies consisting of 510,388,718 people shows no correlation between the proportion of Koreans and poverty level in the United States with a correlation coefficient (R) of -0.021 and weighted average of 10.9%, a difference of 52.2%.
Poverty Correlation Summary
| Measurement | Colville | Korean |
| Minimum | 5.6% | 0.27% |
| Maximum | 47.7% | 27.2% |
| Range | 42.2% | 27.0% |
| Mean | 22.1% | 9.8% |
| Median | 19.3% | 9.3% |
| Interquartile 25% (IQ1) | 15.3% | 7.5% |
| Interquartile 75% (IQ3) | 26.9% | 11.6% |
| Interquartile Range (IQR) | 11.5% | 4.0% |
| Standard Deviation (Sample) | 9.8% | 3.9% |
| Standard Deviation (Population) | 9.7% | 3.8% |
Similar Demographics by Poverty
Demographics Similar to Colville by Poverty
In terms of poverty, the demographic groups most similar to Colville are Yakama (16.7%, a difference of 0.54%), Menominee (16.4%, a difference of 0.75%), Central American Indian (16.7%, a difference of 0.77%), Paiute (16.7%, a difference of 1.1%), and Kiowa (16.8%, a difference of 1.6%).
| Demographics | Rating | Rank | Poverty |
| Hondurans | 0.0 /100 | #316 | Tragic 15.9% |
| U.S. Virgin Islanders | 0.0 /100 | #317 | Tragic 16.1% |
| Immigrants | Dominica | 0.0 /100 | #318 | Tragic 16.1% |
| Immigrants | Congo | 0.0 /100 | #319 | Tragic 16.1% |
| Immigrants | Honduras | 0.0 /100 | #320 | Tragic 16.2% |
| Arapaho | 0.0 /100 | #321 | Tragic 16.3% |
| Menominee | 0.0 /100 | #322 | Tragic 16.4% |
| Colville | 0.0 /100 | #323 | Tragic 16.6% |
| Yakama | 0.0 /100 | #324 | Tragic 16.7% |
| Central American Indians | 0.0 /100 | #325 | Tragic 16.7% |
| Paiute | 0.0 /100 | #326 | Tragic 16.7% |
| Kiowa | 0.0 /100 | #327 | Tragic 16.8% |
| Ute | 0.0 /100 | #328 | Tragic 16.9% |
| Blacks/African Americans | 0.0 /100 | #329 | Tragic 17.3% |
| Dominicans | 0.0 /100 | #330 | Tragic 17.6% |
Demographics Similar to Koreans by Poverty
In terms of poverty, the demographic groups most similar to Koreans are Immigrants from Singapore (10.9%, a difference of 0.050%), Immigrants from Moldova (10.9%, a difference of 0.19%), Immigrants from Iran (10.9%, a difference of 0.22%), Russian (10.9%, a difference of 0.31%), and Immigrants from Pakistan (10.8%, a difference of 0.36%).
| Demographics | Rating | Rank | Poverty |
| Tongans | 99.4 /100 | #35 | Exceptional 10.8% |
| Cypriots | 99.3 /100 | #36 | Exceptional 10.8% |
| Immigrants | Greece | 99.3 /100 | #37 | Exceptional 10.8% |
| Czechs | 99.3 /100 | #38 | Exceptional 10.8% |
| Immigrants | Pakistan | 99.3 /100 | #39 | Exceptional 10.8% |
| Russians | 99.3 /100 | #40 | Exceptional 10.9% |
| Immigrants | Iran | 99.2 /100 | #41 | Exceptional 10.9% |
| Koreans | 99.2 /100 | #42 | Exceptional 10.9% |
| Immigrants | Singapore | 99.2 /100 | #43 | Exceptional 10.9% |
| Immigrants | Moldova | 99.1 /100 | #44 | Exceptional 10.9% |
| Turks | 98.9 /100 | #45 | Exceptional 11.0% |
| Immigrants | Czechoslovakia | 98.9 /100 | #46 | Exceptional 11.0% |
| Immigrants | Romania | 98.9 /100 | #47 | Exceptional 11.0% |
| Slovenes | 98.9 /100 | #48 | Exceptional 11.0% |
| Immigrants | Japan | 98.9 /100 | #49 | Exceptional 11.0% |