Immigrants from Bahamas vs Venezuelan Poverty
COMPARE
Immigrants from Bahamas
Venezuelan
Poverty
Poverty Comparison
Immigrants from Bahamas
Venezuelans
14.8%
POVERTY
0.0/ 100
METRIC RATING
276th/ 347
METRIC RANK
12.2%
POVERTY
56.9/ 100
METRIC RATING
166th/ 347
METRIC RANK
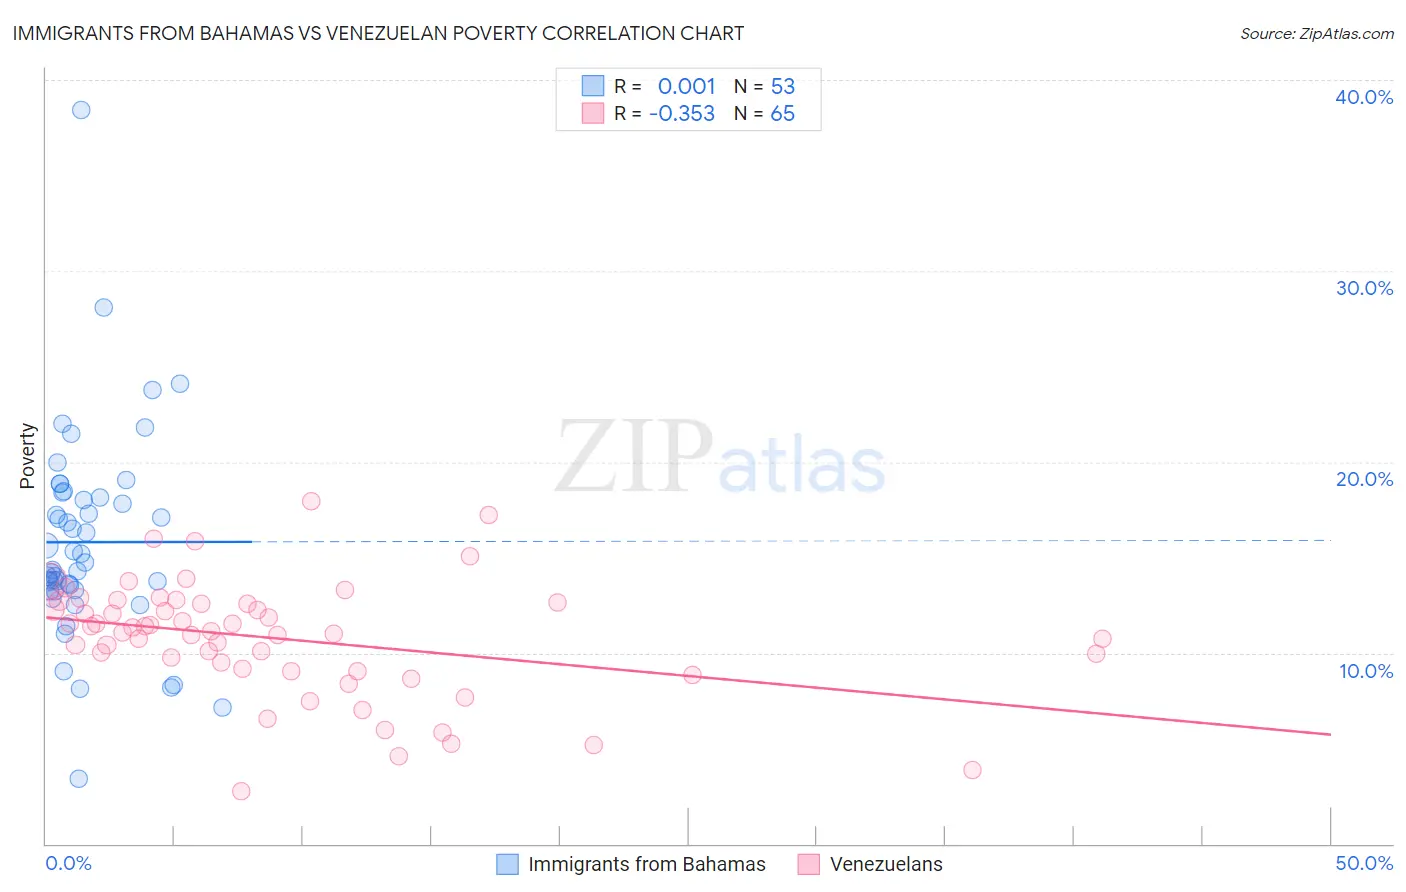
Immigrants from Bahamas vs Venezuelan Poverty Correlation Chart
The statistical analysis conducted on geographies consisting of 104,609,154 people shows no correlation between the proportion of Immigrants from Bahamas and poverty level in the United States with a correlation coefficient (R) of 0.001 and weighted average of 14.8%. Similarly, the statistical analysis conducted on geographies consisting of 306,018,629 people shows a mild negative correlation between the proportion of Venezuelans and poverty level in the United States with a correlation coefficient (R) of -0.353 and weighted average of 12.2%, a difference of 21.0%.
Poverty Correlation Summary
| Measurement | Immigrants from Bahamas | Venezuelan |
| Minimum | 3.4% | 2.7% |
| Maximum | 38.4% | 17.9% |
| Range | 35.0% | 15.2% |
| Mean | 15.8% | 10.7% |
| Median | 14.7% | 11.1% |
| Interquartile 25% (IQ1) | 13.3% | 9.1% |
| Interquartile 75% (IQ3) | 18.3% | 12.6% |
| Interquartile Range (IQR) | 5.0% | 3.5% |
| Standard Deviation (Sample) | 5.5% | 3.0% |
| Standard Deviation (Population) | 5.4% | 3.0% |
Similar Demographics by Poverty
Demographics Similar to Immigrants from Bahamas by Poverty
In terms of poverty, the demographic groups most similar to Immigrants from Bahamas are Immigrants from West Indies (14.8%, a difference of 0.0%), Barbadian (14.8%, a difference of 0.040%), Bangladeshi (14.8%, a difference of 0.050%), Belizean (14.8%, a difference of 0.070%), and Immigrants from St. Vincent and the Grenadines (14.9%, a difference of 0.37%).
| Demographics | Rating | Rank | Poverty |
| Immigrants | Cuba | 0.1 /100 | #269 | Tragic 14.6% |
| Central Americans | 0.1 /100 | #270 | Tragic 14.6% |
| Shoshone | 0.0 /100 | #271 | Tragic 14.7% |
| Chickasaw | 0.0 /100 | #272 | Tragic 14.7% |
| Spanish Americans | 0.0 /100 | #273 | Tragic 14.7% |
| Barbadians | 0.0 /100 | #274 | Tragic 14.8% |
| Immigrants | West Indies | 0.0 /100 | #275 | Tragic 14.8% |
| Immigrants | Bahamas | 0.0 /100 | #276 | Tragic 14.8% |
| Bangladeshis | 0.0 /100 | #277 | Tragic 14.8% |
| Belizeans | 0.0 /100 | #278 | Tragic 14.8% |
| Immigrants | St. Vincent and the Grenadines | 0.0 /100 | #279 | Tragic 14.9% |
| Haitians | 0.0 /100 | #280 | Tragic 14.9% |
| Immigrants | Barbados | 0.0 /100 | #281 | Tragic 14.9% |
| Comanche | 0.0 /100 | #282 | Tragic 15.0% |
| Immigrants | Haiti | 0.0 /100 | #283 | Tragic 15.0% |
Demographics Similar to Venezuelans by Poverty
In terms of poverty, the demographic groups most similar to Venezuelans are Immigrants from Chile (12.2%, a difference of 0.020%), Immigrants from Venezuela (12.2%, a difference of 0.040%), Immigrants from Albania (12.2%, a difference of 0.090%), Colombian (12.2%, a difference of 0.10%), and White/Caucasian (12.3%, a difference of 0.15%).
| Demographics | Rating | Rank | Poverty |
| Pennsylvania Germans | 60.8 /100 | #159 | Good 12.2% |
| Immigrants | Nepal | 60.4 /100 | #160 | Good 12.2% |
| Immigrants | Fiji | 59.1 /100 | #161 | Average 12.2% |
| Ethiopians | 59.1 /100 | #162 | Average 12.2% |
| Immigrants | Ethiopia | 58.6 /100 | #163 | Average 12.2% |
| Colombians | 57.8 /100 | #164 | Average 12.2% |
| Immigrants | Albania | 57.7 /100 | #165 | Average 12.2% |
| Venezuelans | 56.9 /100 | #166 | Average 12.2% |
| Immigrants | Chile | 56.7 /100 | #167 | Average 12.2% |
| Immigrants | Venezuela | 56.5 /100 | #168 | Average 12.2% |
| Whites/Caucasians | 55.4 /100 | #169 | Average 12.3% |
| Immigrants | Oceania | 54.6 /100 | #170 | Average 12.3% |
| Immigrants | Spain | 51.3 /100 | #171 | Average 12.3% |
| Immigrants | Portugal | 50.5 /100 | #172 | Average 12.3% |
| Celtics | 50.1 /100 | #173 | Average 12.3% |