Immigrants from Bahamas vs Greek Poverty
COMPARE
Immigrants from Bahamas
Greek
Poverty
Poverty Comparison
Immigrants from Bahamas
Greeks
14.8%
POVERTY
0.0/ 100
METRIC RATING
276th/ 347
METRIC RANK
10.7%
POVERTY
99.5/ 100
METRIC RATING
29th/ 347
METRIC RANK
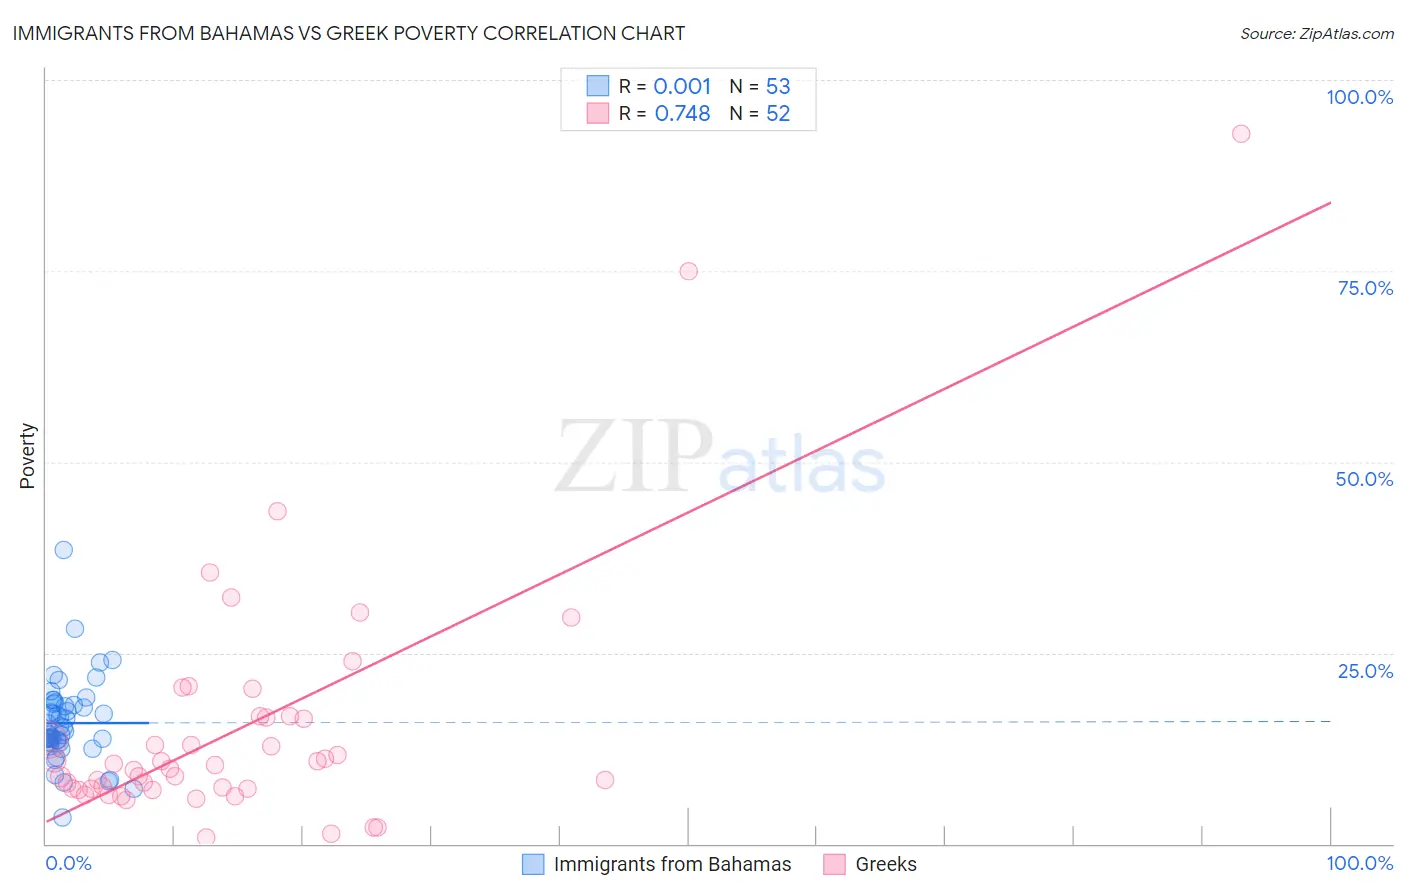
Immigrants from Bahamas vs Greek Poverty Correlation Chart
The statistical analysis conducted on geographies consisting of 104,609,154 people shows no correlation between the proportion of Immigrants from Bahamas and poverty level in the United States with a correlation coefficient (R) of 0.001 and weighted average of 14.8%. Similarly, the statistical analysis conducted on geographies consisting of 482,333,537 people shows a strong positive correlation between the proportion of Greeks and poverty level in the United States with a correlation coefficient (R) of 0.748 and weighted average of 10.7%, a difference of 38.1%.
Poverty Correlation Summary
| Measurement | Immigrants from Bahamas | Greek |
| Minimum | 3.4% | 0.75% |
| Maximum | 38.4% | 93.0% |
| Range | 35.0% | 92.3% |
| Mean | 15.8% | 15.2% |
| Median | 14.7% | 10.1% |
| Interquartile 25% (IQ1) | 13.3% | 7.2% |
| Interquartile 75% (IQ3) | 18.3% | 16.6% |
| Interquartile Range (IQR) | 5.0% | 9.4% |
| Standard Deviation (Sample) | 5.5% | 16.5% |
| Standard Deviation (Population) | 5.4% | 16.4% |
Similar Demographics by Poverty
Demographics Similar to Immigrants from Bahamas by Poverty
In terms of poverty, the demographic groups most similar to Immigrants from Bahamas are Immigrants from West Indies (14.8%, a difference of 0.0%), Barbadian (14.8%, a difference of 0.040%), Bangladeshi (14.8%, a difference of 0.050%), Belizean (14.8%, a difference of 0.070%), and Immigrants from St. Vincent and the Grenadines (14.9%, a difference of 0.37%).
| Demographics | Rating | Rank | Poverty |
| Immigrants | Cuba | 0.1 /100 | #269 | Tragic 14.6% |
| Central Americans | 0.1 /100 | #270 | Tragic 14.6% |
| Shoshone | 0.0 /100 | #271 | Tragic 14.7% |
| Chickasaw | 0.0 /100 | #272 | Tragic 14.7% |
| Spanish Americans | 0.0 /100 | #273 | Tragic 14.7% |
| Barbadians | 0.0 /100 | #274 | Tragic 14.8% |
| Immigrants | West Indies | 0.0 /100 | #275 | Tragic 14.8% |
| Immigrants | Bahamas | 0.0 /100 | #276 | Tragic 14.8% |
| Bangladeshis | 0.0 /100 | #277 | Tragic 14.8% |
| Belizeans | 0.0 /100 | #278 | Tragic 14.8% |
| Immigrants | St. Vincent and the Grenadines | 0.0 /100 | #279 | Tragic 14.9% |
| Haitians | 0.0 /100 | #280 | Tragic 14.9% |
| Immigrants | Barbados | 0.0 /100 | #281 | Tragic 14.9% |
| Comanche | 0.0 /100 | #282 | Tragic 15.0% |
| Immigrants | Haiti | 0.0 /100 | #283 | Tragic 15.0% |
Demographics Similar to Greeks by Poverty
In terms of poverty, the demographic groups most similar to Greeks are Danish (10.7%, a difference of 0.010%), Immigrants from Korea (10.7%, a difference of 0.090%), Polish (10.7%, a difference of 0.090%), Immigrants from Northern Europe (10.7%, a difference of 0.16%), and Iranian (10.7%, a difference of 0.18%).
| Demographics | Rating | Rank | Poverty |
| Eastern Europeans | 99.7 /100 | #22 | Exceptional 10.6% |
| Swedes | 99.7 /100 | #23 | Exceptional 10.6% |
| Italians | 99.7 /100 | #24 | Exceptional 10.6% |
| Croatians | 99.6 /100 | #25 | Exceptional 10.6% |
| Burmese | 99.6 /100 | #26 | Exceptional 10.7% |
| Immigrants | Northern Europe | 99.6 /100 | #27 | Exceptional 10.7% |
| Immigrants | Korea | 99.5 /100 | #28 | Exceptional 10.7% |
| Greeks | 99.5 /100 | #29 | Exceptional 10.7% |
| Danes | 99.5 /100 | #30 | Exceptional 10.7% |
| Poles | 99.5 /100 | #31 | Exceptional 10.7% |
| Iranians | 99.5 /100 | #32 | Exceptional 10.7% |
| Macedonians | 99.4 /100 | #33 | Exceptional 10.8% |
| Immigrants | Poland | 99.4 /100 | #34 | Exceptional 10.8% |
| Tongans | 99.4 /100 | #35 | Exceptional 10.8% |
| Cypriots | 99.3 /100 | #36 | Exceptional 10.8% |