Immigrants from Bahamas vs Immigrants from Europe Poverty
COMPARE
Immigrants from Bahamas
Immigrants from Europe
Poverty
Poverty Comparison
Immigrants from Bahamas
Immigrants from Europe
14.8%
POVERTY
0.0/ 100
METRIC RATING
276th/ 347
METRIC RANK
11.2%
POVERTY
98.0/ 100
METRIC RATING
59th/ 347
METRIC RANK
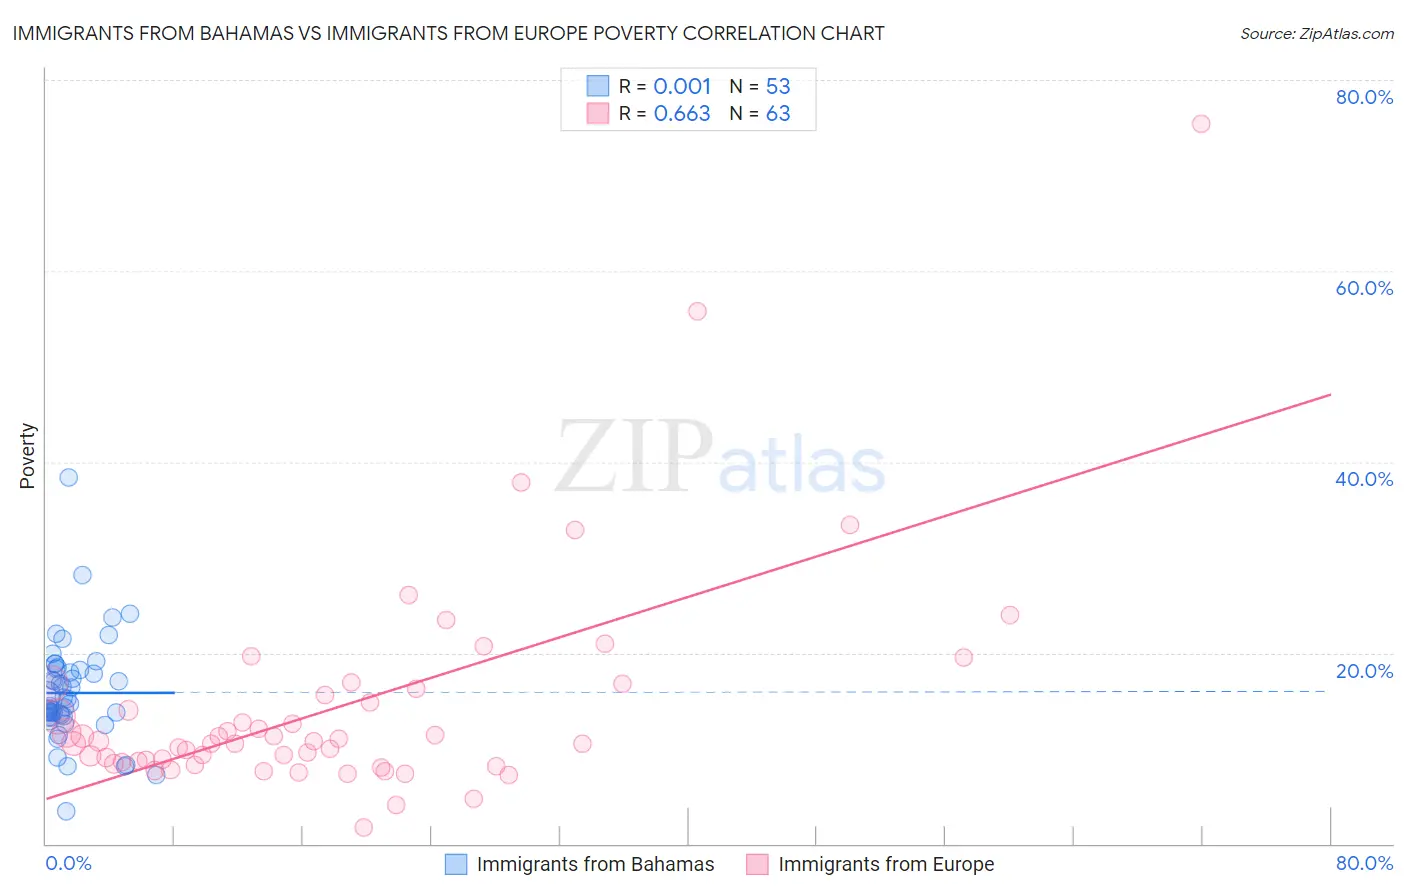
Immigrants from Bahamas vs Immigrants from Europe Poverty Correlation Chart
The statistical analysis conducted on geographies consisting of 104,609,154 people shows no correlation between the proportion of Immigrants from Bahamas and poverty level in the United States with a correlation coefficient (R) of 0.001 and weighted average of 14.8%. Similarly, the statistical analysis conducted on geographies consisting of 546,769,385 people shows a significant positive correlation between the proportion of Immigrants from Europe and poverty level in the United States with a correlation coefficient (R) of 0.663 and weighted average of 11.2%, a difference of 32.8%.
Poverty Correlation Summary
| Measurement | Immigrants from Bahamas | Immigrants from Europe |
| Minimum | 3.4% | 1.7% |
| Maximum | 38.4% | 75.4% |
| Range | 35.0% | 73.7% |
| Mean | 15.8% | 14.4% |
| Median | 14.7% | 10.7% |
| Interquartile 25% (IQ1) | 13.3% | 8.6% |
| Interquartile 75% (IQ3) | 18.3% | 16.3% |
| Interquartile Range (IQR) | 5.0% | 7.7% |
| Standard Deviation (Sample) | 5.5% | 11.7% |
| Standard Deviation (Population) | 5.4% | 11.6% |
Similar Demographics by Poverty
Demographics Similar to Immigrants from Bahamas by Poverty
In terms of poverty, the demographic groups most similar to Immigrants from Bahamas are Immigrants from West Indies (14.8%, a difference of 0.0%), Barbadian (14.8%, a difference of 0.040%), Bangladeshi (14.8%, a difference of 0.050%), Belizean (14.8%, a difference of 0.070%), and Immigrants from St. Vincent and the Grenadines (14.9%, a difference of 0.37%).
| Demographics | Rating | Rank | Poverty |
| Immigrants | Cuba | 0.1 /100 | #269 | Tragic 14.6% |
| Central Americans | 0.1 /100 | #270 | Tragic 14.6% |
| Shoshone | 0.0 /100 | #271 | Tragic 14.7% |
| Chickasaw | 0.0 /100 | #272 | Tragic 14.7% |
| Spanish Americans | 0.0 /100 | #273 | Tragic 14.7% |
| Barbadians | 0.0 /100 | #274 | Tragic 14.8% |
| Immigrants | West Indies | 0.0 /100 | #275 | Tragic 14.8% |
| Immigrants | Bahamas | 0.0 /100 | #276 | Tragic 14.8% |
| Bangladeshis | 0.0 /100 | #277 | Tragic 14.8% |
| Belizeans | 0.0 /100 | #278 | Tragic 14.8% |
| Immigrants | St. Vincent and the Grenadines | 0.0 /100 | #279 | Tragic 14.9% |
| Haitians | 0.0 /100 | #280 | Tragic 14.9% |
| Immigrants | Barbados | 0.0 /100 | #281 | Tragic 14.9% |
| Comanche | 0.0 /100 | #282 | Tragic 15.0% |
| Immigrants | Haiti | 0.0 /100 | #283 | Tragic 15.0% |
Demographics Similar to Immigrants from Europe by Poverty
In terms of poverty, the demographic groups most similar to Immigrants from Europe are German (11.1%, a difference of 0.15%), Immigrants from Sri Lanka (11.2%, a difference of 0.16%), Scandinavian (11.1%, a difference of 0.21%), Immigrants from Italy (11.2%, a difference of 0.22%), and Estonian (11.1%, a difference of 0.25%).
| Demographics | Rating | Rank | Poverty |
| Immigrants | Philippines | 98.7 /100 | #52 | Exceptional 11.0% |
| Immigrants | Austria | 98.6 /100 | #53 | Exceptional 11.1% |
| Immigrants | Bulgaria | 98.5 /100 | #54 | Exceptional 11.1% |
| Immigrants | Serbia | 98.5 /100 | #55 | Exceptional 11.1% |
| Estonians | 98.2 /100 | #56 | Exceptional 11.1% |
| Scandinavians | 98.2 /100 | #57 | Exceptional 11.1% |
| Germans | 98.1 /100 | #58 | Exceptional 11.1% |
| Immigrants | Europe | 98.0 /100 | #59 | Exceptional 11.2% |
| Immigrants | Sri Lanka | 97.9 /100 | #60 | Exceptional 11.2% |
| Immigrants | Italy | 97.9 /100 | #61 | Exceptional 11.2% |
| Austrians | 97.8 /100 | #62 | Exceptional 11.2% |
| Ukrainians | 97.8 /100 | #63 | Exceptional 11.2% |
| Swiss | 97.7 /100 | #64 | Exceptional 11.2% |
| Immigrants | Asia | 97.5 /100 | #65 | Exceptional 11.2% |
| Immigrants | Netherlands | 97.5 /100 | #66 | Exceptional 11.2% |