Immigrants from Bahamas vs Scotch-Irish Poverty
COMPARE
Immigrants from Bahamas
Scotch-Irish
Poverty
Poverty Comparison
Immigrants from Bahamas
Scotch-Irish
14.8%
POVERTY
0.0/ 100
METRIC RATING
276th/ 347
METRIC RANK
12.2%
POVERTY
62.6/ 100
METRIC RATING
156th/ 347
METRIC RANK
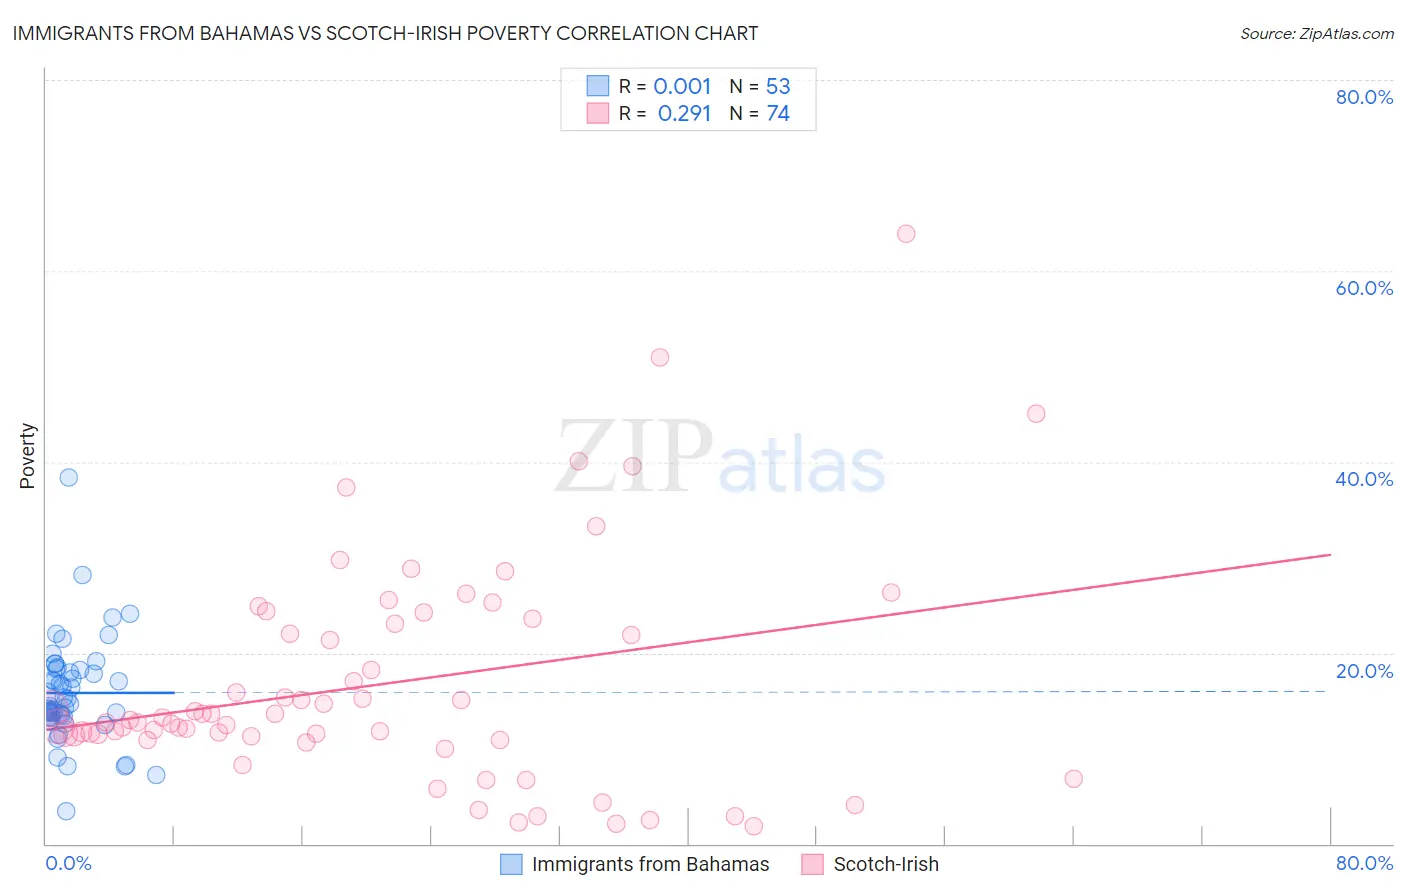
Immigrants from Bahamas vs Scotch-Irish Poverty Correlation Chart
The statistical analysis conducted on geographies consisting of 104,609,154 people shows no correlation between the proportion of Immigrants from Bahamas and poverty level in the United States with a correlation coefficient (R) of 0.001 and weighted average of 14.8%. Similarly, the statistical analysis conducted on geographies consisting of 548,217,294 people shows a weak positive correlation between the proportion of Scotch-Irish and poverty level in the United States with a correlation coefficient (R) of 0.291 and weighted average of 12.2%, a difference of 21.7%.
Poverty Correlation Summary
| Measurement | Immigrants from Bahamas | Scotch-Irish |
| Minimum | 3.4% | 1.8% |
| Maximum | 38.4% | 63.9% |
| Range | 35.0% | 62.1% |
| Mean | 15.8% | 16.7% |
| Median | 14.7% | 12.9% |
| Interquartile 25% (IQ1) | 13.3% | 11.3% |
| Interquartile 75% (IQ3) | 18.3% | 23.0% |
| Interquartile Range (IQR) | 5.0% | 11.7% |
| Standard Deviation (Sample) | 5.5% | 11.7% |
| Standard Deviation (Population) | 5.4% | 11.6% |
Similar Demographics by Poverty
Demographics Similar to Immigrants from Bahamas by Poverty
In terms of poverty, the demographic groups most similar to Immigrants from Bahamas are Immigrants from West Indies (14.8%, a difference of 0.0%), Barbadian (14.8%, a difference of 0.040%), Bangladeshi (14.8%, a difference of 0.050%), Belizean (14.8%, a difference of 0.070%), and Immigrants from St. Vincent and the Grenadines (14.9%, a difference of 0.37%).
| Demographics | Rating | Rank | Poverty |
| Immigrants | Cuba | 0.1 /100 | #269 | Tragic 14.6% |
| Central Americans | 0.1 /100 | #270 | Tragic 14.6% |
| Shoshone | 0.0 /100 | #271 | Tragic 14.7% |
| Chickasaw | 0.0 /100 | #272 | Tragic 14.7% |
| Spanish Americans | 0.0 /100 | #273 | Tragic 14.7% |
| Barbadians | 0.0 /100 | #274 | Tragic 14.8% |
| Immigrants | West Indies | 0.0 /100 | #275 | Tragic 14.8% |
| Immigrants | Bahamas | 0.0 /100 | #276 | Tragic 14.8% |
| Bangladeshis | 0.0 /100 | #277 | Tragic 14.8% |
| Belizeans | 0.0 /100 | #278 | Tragic 14.8% |
| Immigrants | St. Vincent and the Grenadines | 0.0 /100 | #279 | Tragic 14.9% |
| Haitians | 0.0 /100 | #280 | Tragic 14.9% |
| Immigrants | Barbados | 0.0 /100 | #281 | Tragic 14.9% |
| Comanche | 0.0 /100 | #282 | Tragic 15.0% |
| Immigrants | Haiti | 0.0 /100 | #283 | Tragic 15.0% |
Demographics Similar to Scotch-Irish by Poverty
In terms of poverty, the demographic groups most similar to Scotch-Irish are Costa Rican (12.2%, a difference of 0.040%), Taiwanese (12.2%, a difference of 0.080%), Hungarian (12.2%, a difference of 0.11%), Guamanian/Chamorro (12.1%, a difference of 0.14%), and Immigrants from Northern Africa (12.1%, a difference of 0.15%).
| Demographics | Rating | Rank | Poverty |
| Immigrants | Malaysia | 72.7 /100 | #149 | Good 12.0% |
| Immigrants | Kazakhstan | 72.3 /100 | #150 | Good 12.0% |
| Samoans | 71.9 /100 | #151 | Good 12.0% |
| Armenians | 67.6 /100 | #152 | Good 12.1% |
| Immigrants | Northern Africa | 63.9 /100 | #153 | Good 12.1% |
| Guamanians/Chamorros | 63.9 /100 | #154 | Good 12.1% |
| Hungarians | 63.6 /100 | #155 | Good 12.2% |
| Scotch-Irish | 62.6 /100 | #156 | Good 12.2% |
| Costa Ricans | 62.2 /100 | #157 | Good 12.2% |
| Taiwanese | 61.8 /100 | #158 | Good 12.2% |
| Pennsylvania Germans | 60.8 /100 | #159 | Good 12.2% |
| Immigrants | Nepal | 60.4 /100 | #160 | Good 12.2% |
| Immigrants | Fiji | 59.1 /100 | #161 | Average 12.2% |
| Ethiopians | 59.1 /100 | #162 | Average 12.2% |
| Immigrants | Ethiopia | 58.6 /100 | #163 | Average 12.2% |