Immigrants from Bahamas vs Liberian Poverty
COMPARE
Immigrants from Bahamas
Liberian
Poverty
Poverty Comparison
Immigrants from Bahamas
Liberians
14.8%
POVERTY
0.0/ 100
METRIC RATING
276th/ 347
METRIC RANK
14.1%
POVERTY
0.2/ 100
METRIC RATING
247th/ 347
METRIC RANK
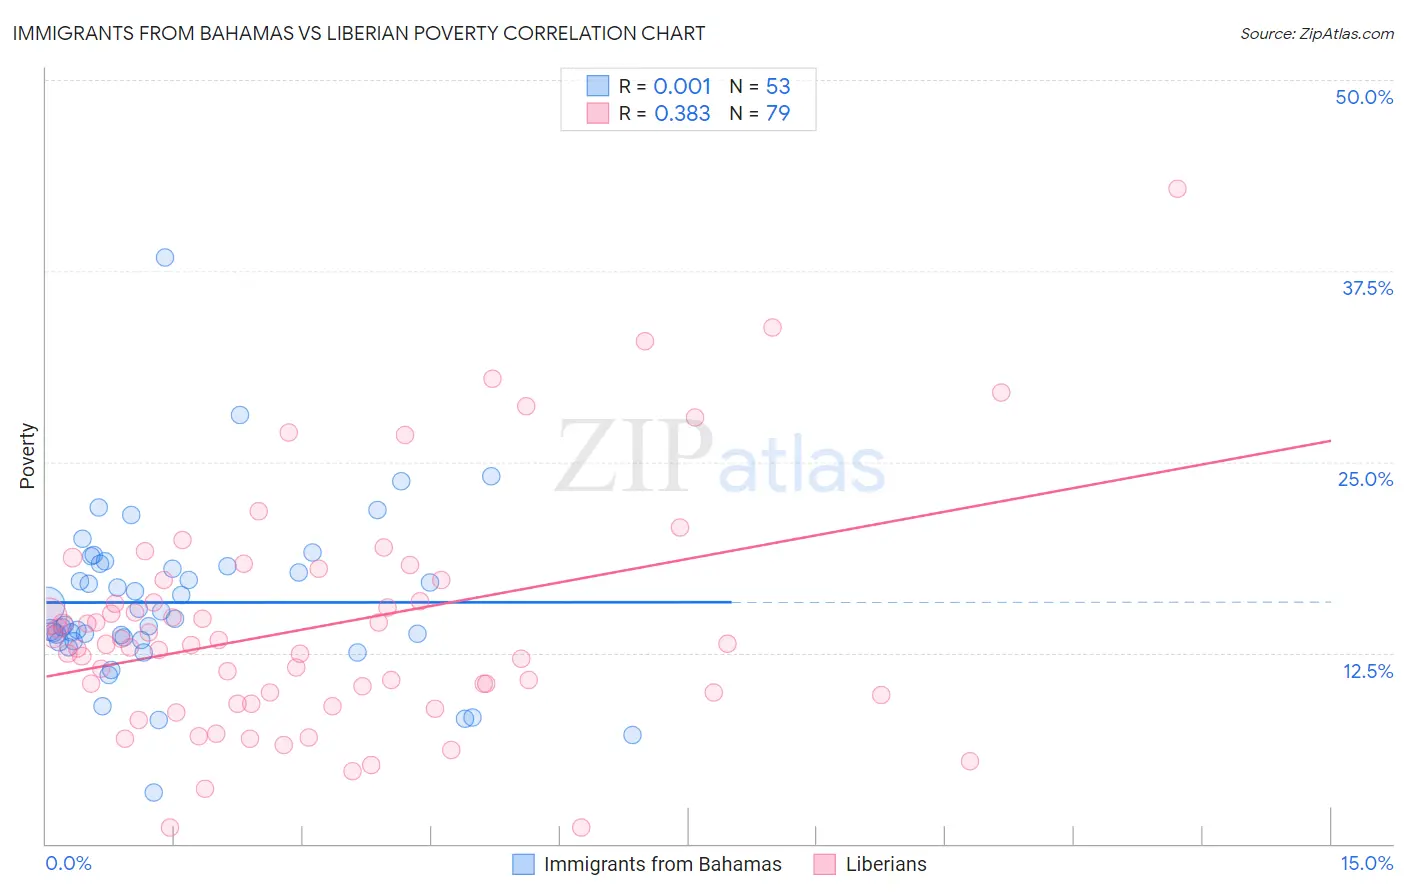
Immigrants from Bahamas vs Liberian Poverty Correlation Chart
The statistical analysis conducted on geographies consisting of 104,609,154 people shows no correlation between the proportion of Immigrants from Bahamas and poverty level in the United States with a correlation coefficient (R) of 0.001 and weighted average of 14.8%. Similarly, the statistical analysis conducted on geographies consisting of 118,042,560 people shows a mild positive correlation between the proportion of Liberians and poverty level in the United States with a correlation coefficient (R) of 0.383 and weighted average of 14.1%, a difference of 4.7%.
Poverty Correlation Summary
| Measurement | Immigrants from Bahamas | Liberian |
| Minimum | 3.4% | 1.0% |
| Maximum | 38.4% | 42.9% |
| Range | 35.0% | 41.9% |
| Mean | 15.8% | 14.3% |
| Median | 14.7% | 13.1% |
| Interquartile 25% (IQ1) | 13.3% | 9.8% |
| Interquartile 75% (IQ3) | 18.3% | 17.3% |
| Interquartile Range (IQR) | 5.0% | 7.5% |
| Standard Deviation (Sample) | 5.5% | 7.6% |
| Standard Deviation (Population) | 5.4% | 7.6% |
Similar Demographics by Poverty
Demographics Similar to Immigrants from Bahamas by Poverty
In terms of poverty, the demographic groups most similar to Immigrants from Bahamas are Immigrants from West Indies (14.8%, a difference of 0.0%), Barbadian (14.8%, a difference of 0.040%), Bangladeshi (14.8%, a difference of 0.050%), Belizean (14.8%, a difference of 0.070%), and Immigrants from St. Vincent and the Grenadines (14.9%, a difference of 0.37%).
| Demographics | Rating | Rank | Poverty |
| Immigrants | Cuba | 0.1 /100 | #269 | Tragic 14.6% |
| Central Americans | 0.1 /100 | #270 | Tragic 14.6% |
| Shoshone | 0.0 /100 | #271 | Tragic 14.7% |
| Chickasaw | 0.0 /100 | #272 | Tragic 14.7% |
| Spanish Americans | 0.0 /100 | #273 | Tragic 14.7% |
| Barbadians | 0.0 /100 | #274 | Tragic 14.8% |
| Immigrants | West Indies | 0.0 /100 | #275 | Tragic 14.8% |
| Immigrants | Bahamas | 0.0 /100 | #276 | Tragic 14.8% |
| Bangladeshis | 0.0 /100 | #277 | Tragic 14.8% |
| Belizeans | 0.0 /100 | #278 | Tragic 14.8% |
| Immigrants | St. Vincent and the Grenadines | 0.0 /100 | #279 | Tragic 14.9% |
| Haitians | 0.0 /100 | #280 | Tragic 14.9% |
| Immigrants | Barbados | 0.0 /100 | #281 | Tragic 14.9% |
| Comanche | 0.0 /100 | #282 | Tragic 15.0% |
| Immigrants | Haiti | 0.0 /100 | #283 | Tragic 15.0% |
Demographics Similar to Liberians by Poverty
In terms of poverty, the demographic groups most similar to Liberians are Immigrants from Western Africa (14.1%, a difference of 0.020%), Immigrants from Ghana (14.2%, a difference of 0.11%), Potawatomi (14.1%, a difference of 0.28%), Cree (14.2%, a difference of 0.41%), and Immigrants from Sudan (14.1%, a difference of 0.48%).
| Demographics | Rating | Rank | Poverty |
| Immigrants | Middle Africa | 0.4 /100 | #240 | Tragic 14.0% |
| Salvadorans | 0.4 /100 | #241 | Tragic 14.0% |
| Ecuadorians | 0.4 /100 | #242 | Tragic 14.0% |
| Sudanese | 0.3 /100 | #243 | Tragic 14.0% |
| Nepalese | 0.3 /100 | #244 | Tragic 14.0% |
| Immigrants | Sudan | 0.3 /100 | #245 | Tragic 14.1% |
| Potawatomi | 0.3 /100 | #246 | Tragic 14.1% |
| Liberians | 0.2 /100 | #247 | Tragic 14.1% |
| Immigrants | Western Africa | 0.2 /100 | #248 | Tragic 14.1% |
| Immigrants | Ghana | 0.2 /100 | #249 | Tragic 14.2% |
| Cree | 0.2 /100 | #250 | Tragic 14.2% |
| Immigrants | Burma/Myanmar | 0.2 /100 | #251 | Tragic 14.2% |
| Spanish American Indians | 0.2 /100 | #252 | Tragic 14.2% |
| Immigrants | Trinidad and Tobago | 0.2 /100 | #253 | Tragic 14.2% |
| Immigrants | El Salvador | 0.1 /100 | #254 | Tragic 14.3% |