Immigrants from El Salvador vs Immigrants from Europe Poverty
COMPARE
Immigrants from El Salvador
Immigrants from Europe
Poverty
Poverty Comparison
Immigrants from El Salvador
Immigrants from Europe
14.3%
POVERTY
0.1/ 100
METRIC RATING
254th/ 347
METRIC RANK
11.2%
POVERTY
98.0/ 100
METRIC RATING
59th/ 347
METRIC RANK
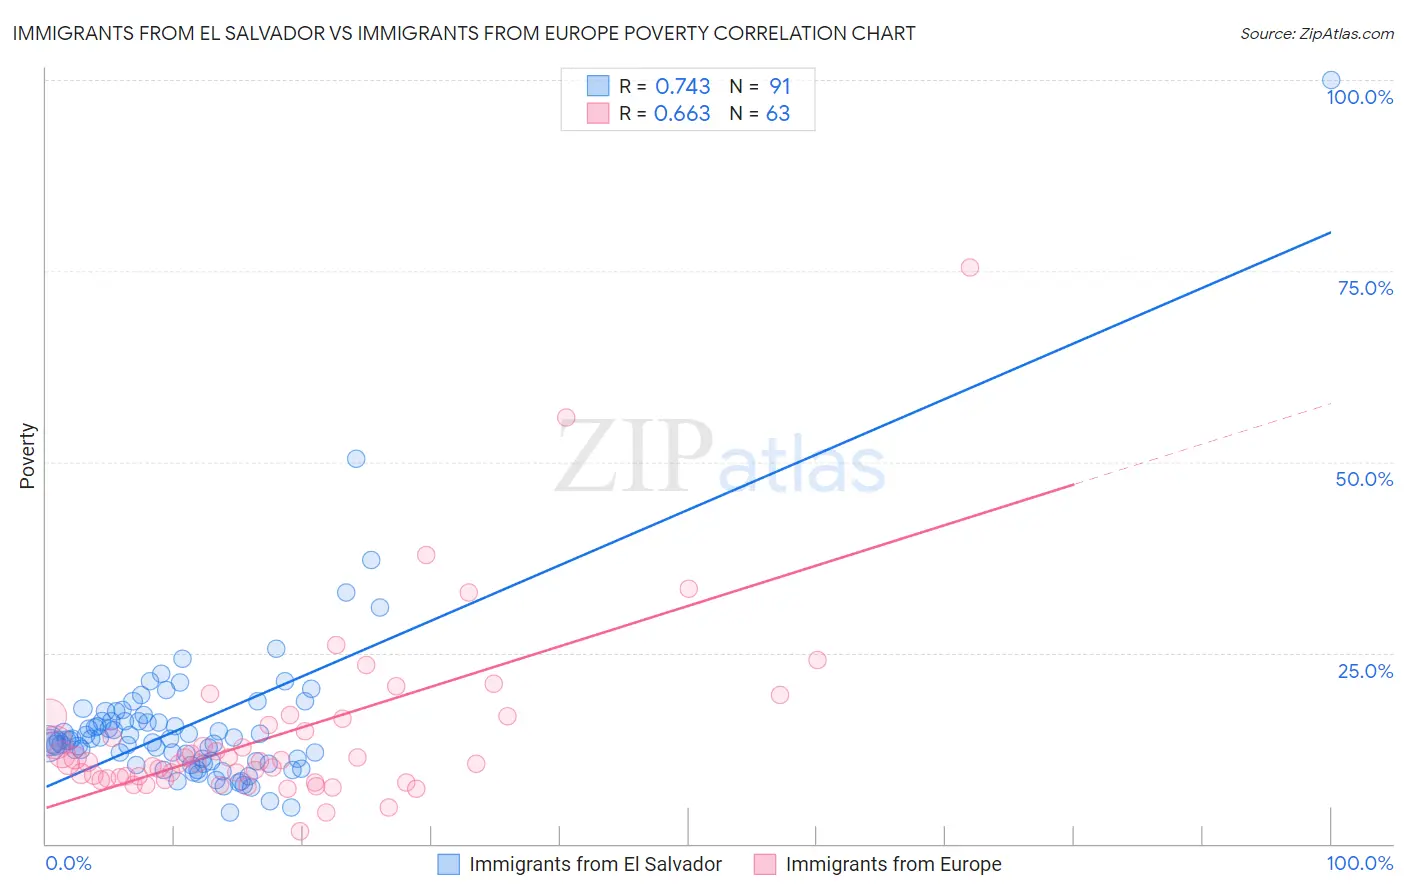
Immigrants from El Salvador vs Immigrants from Europe Poverty Correlation Chart
The statistical analysis conducted on geographies consisting of 357,703,291 people shows a strong positive correlation between the proportion of Immigrants from El Salvador and poverty level in the United States with a correlation coefficient (R) of 0.743 and weighted average of 14.3%. Similarly, the statistical analysis conducted on geographies consisting of 546,769,385 people shows a significant positive correlation between the proportion of Immigrants from Europe and poverty level in the United States with a correlation coefficient (R) of 0.663 and weighted average of 11.2%, a difference of 28.0%.
Poverty Correlation Summary
| Measurement | Immigrants from El Salvador | Immigrants from Europe |
| Minimum | 4.1% | 1.7% |
| Maximum | 100.0% | 75.4% |
| Range | 95.9% | 73.7% |
| Mean | 15.6% | 14.4% |
| Median | 13.5% | 10.7% |
| Interquartile 25% (IQ1) | 10.8% | 8.6% |
| Interquartile 75% (IQ3) | 16.1% | 16.3% |
| Interquartile Range (IQR) | 5.3% | 7.7% |
| Standard Deviation (Sample) | 11.2% | 11.7% |
| Standard Deviation (Population) | 11.1% | 11.6% |
Similar Demographics by Poverty
Demographics Similar to Immigrants from El Salvador by Poverty
In terms of poverty, the demographic groups most similar to Immigrants from El Salvador are Immigrants from Ecuador (14.3%, a difference of 0.10%), Mexican American Indian (14.3%, a difference of 0.11%), Trinidadian and Tobagonian (14.3%, a difference of 0.16%), Ottawa (14.3%, a difference of 0.17%), and Immigrants from Trinidad and Tobago (14.2%, a difference of 0.25%).
| Demographics | Rating | Rank | Poverty |
| Liberians | 0.2 /100 | #247 | Tragic 14.1% |
| Immigrants | Western Africa | 0.2 /100 | #248 | Tragic 14.1% |
| Immigrants | Ghana | 0.2 /100 | #249 | Tragic 14.2% |
| Cree | 0.2 /100 | #250 | Tragic 14.2% |
| Immigrants | Burma/Myanmar | 0.2 /100 | #251 | Tragic 14.2% |
| Spanish American Indians | 0.2 /100 | #252 | Tragic 14.2% |
| Immigrants | Trinidad and Tobago | 0.2 /100 | #253 | Tragic 14.2% |
| Immigrants | El Salvador | 0.1 /100 | #254 | Tragic 14.3% |
| Immigrants | Ecuador | 0.1 /100 | #255 | Tragic 14.3% |
| Mexican American Indians | 0.1 /100 | #256 | Tragic 14.3% |
| Trinidadians and Tobagonians | 0.1 /100 | #257 | Tragic 14.3% |
| Ottawa | 0.1 /100 | #258 | Tragic 14.3% |
| Immigrants | Nicaragua | 0.1 /100 | #259 | Tragic 14.3% |
| Cape Verdeans | 0.1 /100 | #260 | Tragic 14.4% |
| Cherokee | 0.1 /100 | #261 | Tragic 14.4% |
Demographics Similar to Immigrants from Europe by Poverty
In terms of poverty, the demographic groups most similar to Immigrants from Europe are German (11.1%, a difference of 0.15%), Immigrants from Sri Lanka (11.2%, a difference of 0.16%), Scandinavian (11.1%, a difference of 0.21%), Immigrants from Italy (11.2%, a difference of 0.22%), and Estonian (11.1%, a difference of 0.25%).
| Demographics | Rating | Rank | Poverty |
| Immigrants | Philippines | 98.7 /100 | #52 | Exceptional 11.0% |
| Immigrants | Austria | 98.6 /100 | #53 | Exceptional 11.1% |
| Immigrants | Bulgaria | 98.5 /100 | #54 | Exceptional 11.1% |
| Immigrants | Serbia | 98.5 /100 | #55 | Exceptional 11.1% |
| Estonians | 98.2 /100 | #56 | Exceptional 11.1% |
| Scandinavians | 98.2 /100 | #57 | Exceptional 11.1% |
| Germans | 98.1 /100 | #58 | Exceptional 11.1% |
| Immigrants | Europe | 98.0 /100 | #59 | Exceptional 11.2% |
| Immigrants | Sri Lanka | 97.9 /100 | #60 | Exceptional 11.2% |
| Immigrants | Italy | 97.9 /100 | #61 | Exceptional 11.2% |
| Austrians | 97.8 /100 | #62 | Exceptional 11.2% |
| Ukrainians | 97.8 /100 | #63 | Exceptional 11.2% |
| Swiss | 97.7 /100 | #64 | Exceptional 11.2% |
| Immigrants | Asia | 97.5 /100 | #65 | Exceptional 11.2% |
| Immigrants | Netherlands | 97.5 /100 | #66 | Exceptional 11.2% |