Pennsylvania German vs Immigrants from Europe Poverty

COMPARE

Pennsylvania German
Race
Ancestry
AfghanAfricanAlaska NativeAlaskan AthabascanAlbanianAleutAlsatianAmericanApacheArabArapahoArgentineanArmenianAssyrian/Chaldean/SyriacAustralianAustrianBahamianBangladeshiBarbadianBasqueBelgianBelizeanBermudanBhutaneseBlackfeetBolivianBrazilianBritishBritish West IndianBulgarianBurmeseCajunCambodianCanadianCape VerdeanCarpatho RusynCelticCentral AmericanCentral American IndianCherokeeCheyenneChickasawChileanChineseChippewaChoctawColombianColvilleComancheCosta RicanCreeCreekCroatianCrowCubanCypriotCzechCzechoslovakianDanishDelawareDominicanDutchDutch West IndianEastern EuropeanEcuadorianEgyptianEnglishEstonianEthiopianEuropeanFijianFilipinoFinnishFrenchFrench American IndianFrench CanadianGermanGerman RussianGhanaianGreekGuamanian/ChamorroGuatemalanGuyaneseHaitianHmongHonduranHopiHoumaHungarianIcelanderIndian (Asian)IndonesianInupiatIranianIraqiIrishIroquoisIsraeliItalianJamaicanJapaneseJordanianKenyanKiowaKoreanLaotianLatvianLebaneseLiberianLithuanianLumbeeLuxembourgerMacedonianMalaysianMalteseMarshalleseMenomineeMexicanMexican American IndianMongolianMoroccanNative HawaiianNavajoNepaleseNew ZealanderNicaraguanNigerianNorthern EuropeanNorwegianOkinawanOsageOttawaPaiutePakistaniPalestinianPanamanianParaguayanPennsylvania GermanPeruvianPimaPolishPortuguesePotawatomiPuebloPuerto RicanPuget Sound SalishRomanianRussianSalvadoranSamoanScandinavianScotch-IrishScottishSeminoleSenegaleseSerbianShoshoneSierra LeoneanSiouxSlavicSlovakSloveneSomaliSouth AfricanSouth AmericanSouth American IndianSoviet UnionSpaniardSpanishSpanish AmericanSpanish American IndianSri LankanSubsaharan AfricanSudaneseSwedishSwissSyrianTaiwaneseThaiTlingit-HaidaTohono O'OdhamTonganTrinidadian and TobagonianTsimshianTurkishU.S. Virgin IslanderUgandanUkrainianUruguayanUteVenezuelanVietnameseWelshWest IndianYakamaYaquiYugoslavianYumanYup'ikZimbabwean
Immigration
NonimmigrantsImmigrantsAfghanistanAfricaAlbaniaArgentinaArmeniaAsiaAustraliaAustriaBahamasBangladeshBarbadosBelarusBelgiumBelizeBoliviaBosnia and HerzegovinaBrazilBulgariaBurma/MyanmarCabo VerdeCambodiaCameroonCanadaCaribbeanCentral AmericaChileChinaColombiaCongoCosta RicaCroatiaCubaCzechoslovakiaDenmarkDominicaDominican RepublicEastern AfricaEastern AsiaEastern EuropeEcuadorEgyptEl SalvadorEnglandEritreaEthiopiaFijiFranceGermanyGhanaGreeceGrenadaGuatemalaGuyanaHaitiHondurasHong KongHungaryIndiaIndonesiaIranIraqIrelandIsraelItalyJamaicaJapanJordanKazakhstanKenyaKoreaKuwaitLaosLatin AmericaLatviaLebanonLiberiaLithuaniaMalaysiaMexicoMicronesiaMiddle AfricaMoldovaMoroccoNepalNetherlandsNicaraguaNigeriaNorth AmericaNorth MacedoniaNorthern AfricaNorthern EuropeNorwayOceaniaPakistanPanamaPeruPhilippinesPolandPortugalRomaniaRussiaSaudi ArabiaScotlandSenegalSerbiaSierra LeoneSingaporeSomaliaSouth AfricaSouth AmericaSouth Central AsiaSouth Eastern AsiaSouthern EuropeSpainSri LankaSt. Vincent and the GrenadinesSudanSwedenSwitzerlandSyriaTaiwanThailandTrinidad and TobagoTurkeyUgandaUkraineUruguayUzbekistanVenezuelaVietnamWest IndiesWestern AfricaWestern AsiaWestern EuropeYemenZaireZimbabweAzores
Immigrants from Europe
Race
Ancestry
AfghanAfricanAlaska NativeAlaskan AthabascanAlbanianAleutAlsatianAmericanApacheArabArapahoArgentineanArmenianAssyrian/Chaldean/SyriacAustralianAustrianBahamianBangladeshiBarbadianBasqueBelgianBelizeanBermudanBhutaneseBlackfeetBolivianBrazilianBritishBritish West IndianBulgarianBurmeseCajunCambodianCanadianCape VerdeanCarpatho RusynCelticCentral AmericanCentral American IndianCherokeeCheyenneChickasawChileanChineseChippewaChoctawColombianColvilleComancheCosta RicanCreeCreekCroatianCrowCubanCypriotCzechCzechoslovakianDanishDelawareDominicanDutchDutch West IndianEastern EuropeanEcuadorianEgyptianEnglishEstonianEthiopianEuropeanFijianFilipinoFinnishFrenchFrench American IndianFrench CanadianGermanGerman RussianGhanaianGreekGuamanian/ChamorroGuatemalanGuyaneseHaitianHmongHonduranHopiHoumaHungarianIcelanderIndian (Asian)IndonesianInupiatIranianIraqiIrishIroquoisIsraeliItalianJamaicanJapaneseJordanianKenyanKiowaKoreanLaotianLatvianLebaneseLiberianLithuanianLumbeeLuxembourgerMacedonianMalaysianMalteseMarshalleseMenomineeMexicanMexican American IndianMongolianMoroccanNative HawaiianNavajoNepaleseNew ZealanderNicaraguanNigerianNorthern EuropeanNorwegianOkinawanOsageOttawaPaiutePakistaniPalestinianPanamanianParaguayanPeruvianPimaPolishPortuguesePotawatomiPuebloPuerto RicanPuget Sound SalishRomanianRussianSalvadoranSamoanScandinavianScotch-IrishScottishSeminoleSenegaleseSerbianShoshoneSierra LeoneanSiouxSlavicSlovakSloveneSomaliSouth AfricanSouth AmericanSouth American IndianSoviet UnionSpaniardSpanishSpanish AmericanSpanish American IndianSri LankanSubsaharan AfricanSudaneseSwedishSwissSyrianTaiwaneseThaiTlingit-HaidaTohono O'OdhamTonganTrinidadian and TobagonianTsimshianTurkishU.S. Virgin IslanderUgandanUkrainianUruguayanUteVenezuelanVietnameseWelshWest IndianYakamaYaquiYugoslavianYumanYup'ikZimbabwean
Immigration
NonimmigrantsImmigrantsAfghanistanAfricaAlbaniaArgentinaArmeniaAsiaAustraliaAustriaBahamasBangladeshBarbadosBelarusBelgiumBelizeBoliviaBosnia and HerzegovinaBrazilBulgariaBurma/MyanmarCabo VerdeCambodiaCameroonCanadaCaribbeanCentral AmericaChileChinaColombiaCongoCosta RicaCroatiaCubaCzechoslovakiaDenmarkDominicaDominican RepublicEastern AfricaEastern AsiaEastern EuropeEcuadorEgyptEl SalvadorEnglandEritreaEthiopiaEuropeFijiFranceGermanyGhanaGreeceGrenadaGuatemalaGuyanaHaitiHondurasHong KongHungaryIndiaIndonesiaIranIraqIrelandIsraelItalyJamaicaJapanJordanKazakhstanKenyaKoreaKuwaitLaosLatin AmericaLatviaLebanonLiberiaLithuaniaMalaysiaMexicoMicronesiaMiddle AfricaMoldovaMoroccoNepalNetherlandsNicaraguaNigeriaNorth AmericaNorth MacedoniaNorthern AfricaNorthern EuropeNorwayOceaniaPakistanPanamaPeruPhilippinesPolandPortugalRomaniaRussiaSaudi ArabiaScotlandSenegalSerbiaSierra LeoneSingaporeSomaliaSouth AfricaSouth AmericaSouth Central AsiaSouth Eastern AsiaSouthern EuropeSpainSri LankaSt. Vincent and the GrenadinesSudanSwedenSwitzerlandSyriaTaiwanThailandTrinidad and TobagoTurkeyUgandaUkraineUruguayUzbekistanVenezuelaVietnamWest IndiesWestern AfricaWestern AsiaWestern EuropeYemenZaireZimbabweAzores
Poverty
Income
Poverty
Unemployment
Labor Participation
Family Structure
Vehicle Availability
Education Level
Disability

Poverty Comparison

Pennsylvania Germans

Immigrants from Europe

Good
Exceptional
12.2%
POVERTY
60.8/ 100
METRIC RATING
159th/ 347
METRIC RANK
11.2%
POVERTY
98.0/ 100
METRIC RATING
59th/ 347
METRIC RANK

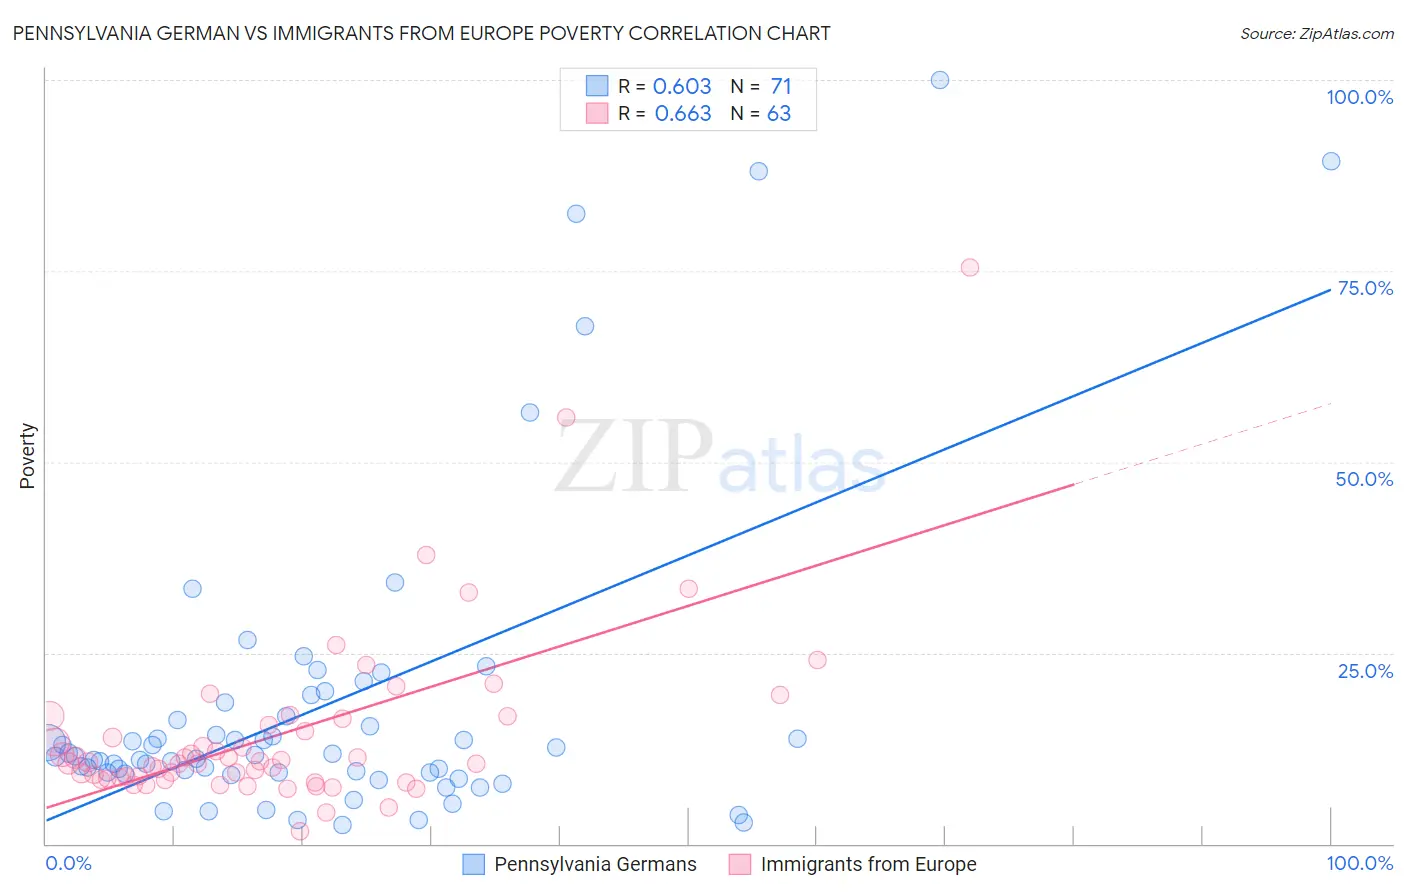
Pennsylvania German vs Immigrants from Europe Poverty Correlation Chart

The statistical analysis conducted on geographies consisting of 234,033,089 people shows a significant positive correlation between the proportion of Pennsylvania Germans and poverty level in the United States with a correlation coefficient (R) of 0.603 and weighted average of 12.2%. Similarly, the statistical analysis conducted on geographies consisting of 546,769,385 people shows a significant positive correlation between the proportion of Immigrants from Europe and poverty level in the United States with a correlation coefficient (R) of 0.663 and weighted average of 11.2%, a difference of 9.3%.
Pennsylvania German vs Immigrants from Europe Poverty

Poverty Correlation Summary

MeasurementPennsylvania GermanImmigrants from Europe
Minimum2.4%1.7%
Maximum100.0%75.4%
Range97.6%73.7%
Mean18.1%14.4%
Median11.4%10.7%
Interquartile 25% (IQ1)9.3%8.6%
Interquartile 75% (IQ3)16.7%16.3%
Interquartile Range (IQR)7.5%7.7%
Standard Deviation (Sample)20.6%11.7%
Standard Deviation (Population)20.5%11.6%

Similar Demographics by Poverty

Demographics Similar to Pennsylvania Germans by Poverty

In terms of poverty, the demographic groups most similar to Pennsylvania Germans are Immigrants from Nepal (12.2%, a difference of 0.050%), Taiwanese (12.2%, a difference of 0.10%), Costa Rican (12.2%, a difference of 0.14%), Scotch-Irish (12.2%, a difference of 0.18%), and Immigrants from Fiji (12.2%, a difference of 0.18%).
DemographicsRating | RankPoverty
Armenians
67.6
/100
|
#152
Good
12.1%
Immigrants | Northern Africa
63.9
/100
|
#153
Good
12.1%
Guamanians/Chamorros
63.9
/100
|
#154
Good
12.1%
Hungarians
63.6
/100
|
#155
Good
12.2%
Scotch-Irish
62.6
/100
|
#156
Good
12.2%
Costa Ricans
62.2
/100
|
#157
Good
12.2%
Taiwanese
61.8
/100
|
#158
Good
12.2%
Pennsylvania Germans
60.8
/100
|
#159
Good
12.2%
Immigrants | Nepal
60.4
/100
|
#160
Good
12.2%
Immigrants | Fiji
59.1
/100
|
#161
Average
12.2%
Ethiopians
59.1
/100
|
#162
Average
12.2%
Immigrants | Ethiopia
58.6
/100
|
#163
Average
12.2%
Colombians
57.8
/100
|
#164
Average
12.2%
Immigrants | Albania
57.7
/100
|
#165
Average
12.2%
Venezuelans
56.9
/100
|
#166
Average
12.2%

Demographics Similar to Immigrants from Europe by Poverty

In terms of poverty, the demographic groups most similar to Immigrants from Europe are German (11.1%, a difference of 0.15%), Immigrants from Sri Lanka (11.2%, a difference of 0.16%), Scandinavian (11.1%, a difference of 0.21%), Immigrants from Italy (11.2%, a difference of 0.22%), and Estonian (11.1%, a difference of 0.25%).
DemographicsRating | RankPoverty
Immigrants | Philippines
98.7
/100
|
#52
Exceptional
11.0%
Immigrants | Austria
98.6
/100
|
#53
Exceptional
11.1%
Immigrants | Bulgaria
98.5
/100
|
#54
Exceptional
11.1%
Immigrants | Serbia
98.5
/100
|
#55
Exceptional
11.1%
Estonians
98.2
/100
|
#56
Exceptional
11.1%
Scandinavians
98.2
/100
|
#57
Exceptional
11.1%
Germans
98.1
/100
|
#58
Exceptional
11.1%
Immigrants | Europe
98.0
/100
|
#59
Exceptional
11.2%
Immigrants | Sri Lanka
97.9
/100
|
#60
Exceptional
11.2%
Immigrants | Italy
97.9
/100
|
#61
Exceptional
11.2%
Austrians
97.8
/100
|
#62
Exceptional
11.2%
Ukrainians
97.8
/100
|
#63
Exceptional
11.2%
Swiss
97.7
/100
|
#64
Exceptional
11.2%
Immigrants | Asia
97.5
/100
|
#65
Exceptional
11.2%
Immigrants | Netherlands
97.5
/100
|
#66
Exceptional
11.2%