Immigrants from Bahamas vs Immigrants from Europe Median Household Income
COMPARE
Immigrants from Bahamas
Immigrants from Europe
Median Household Income
Median Household Income Comparison
Immigrants from Bahamas
Immigrants from Europe
$71,349
MEDIAN HOUSEHOLD INCOME
0.0/ 100
METRIC RATING
313th/ 347
METRIC RANK
$95,032
MEDIAN HOUSEHOLD INCOME
99.8/ 100
METRIC RATING
59th/ 347
METRIC RANK
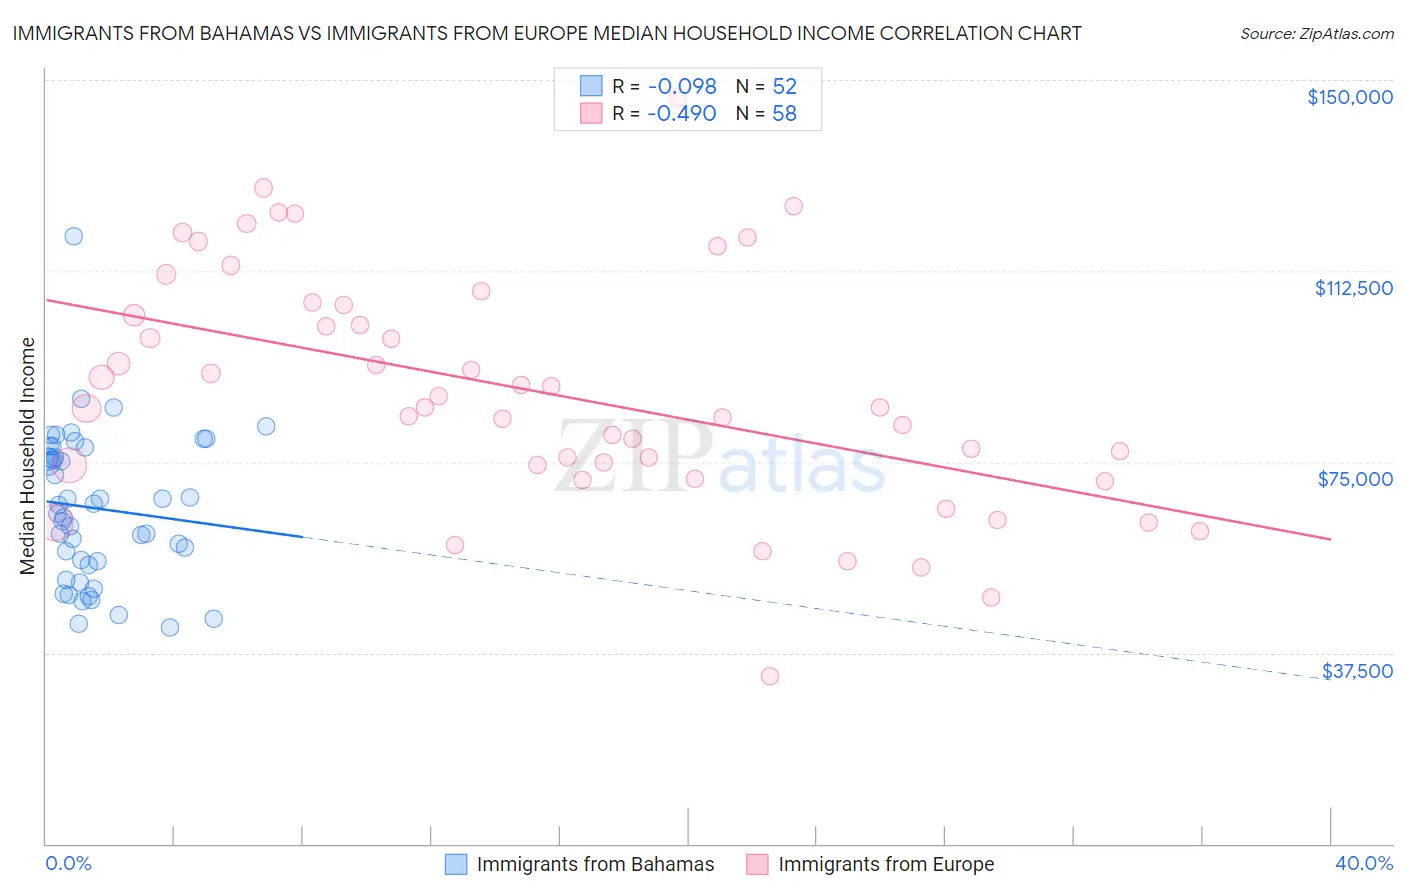
Immigrants from Bahamas vs Immigrants from Europe Median Household Income Correlation Chart
The statistical analysis conducted on geographies consisting of 104,583,931 people shows a slight negative correlation between the proportion of Immigrants from Bahamas and median household income in the United States with a correlation coefficient (R) of -0.098 and weighted average of $71,349. Similarly, the statistical analysis conducted on geographies consisting of 546,586,899 people shows a moderate negative correlation between the proportion of Immigrants from Europe and median household income in the United States with a correlation coefficient (R) of -0.490 and weighted average of $95,032, a difference of 33.2%.
Median Household Income Correlation Summary
| Measurement | Immigrants from Bahamas | Immigrants from Europe |
| Minimum | $42,496 | $32,853 |
| Maximum | $119,201 | $146,675 |
| Range | $76,705 | $113,822 |
| Mean | $65,863 | $88,761 |
| Median | $65,628 | $85,626 |
| Interquartile 25% (IQ1) | $55,065 | $74,349 |
| Interquartile 75% (IQ3) | $76,891 | $105,928 |
| Interquartile Range (IQR) | $21,825 | $31,579 |
| Standard Deviation (Sample) | $14,679 | $23,344 |
| Standard Deviation (Population) | $14,537 | $23,142 |
Similar Demographics by Median Household Income
Demographics Similar to Immigrants from Bahamas by Median Household Income
In terms of median household income, the demographic groups most similar to Immigrants from Bahamas are Dominican ($71,302, a difference of 0.060%), Immigrants from Honduras ($71,452, a difference of 0.15%), Ottawa ($70,984, a difference of 0.51%), Apache ($70,927, a difference of 0.59%), and Immigrants from Zaire ($71,801, a difference of 0.63%).
| Demographics | Rating | Rank | Median Household Income |
| Potawatomi | 0.0 /100 | #306 | Tragic $72,576 |
| Ute | 0.0 /100 | #307 | Tragic $72,402 |
| Yakama | 0.0 /100 | #308 | Tragic $72,225 |
| Immigrants | Caribbean | 0.0 /100 | #309 | Tragic $71,860 |
| U.S. Virgin Islanders | 0.0 /100 | #310 | Tragic $71,853 |
| Immigrants | Zaire | 0.0 /100 | #311 | Tragic $71,801 |
| Immigrants | Honduras | 0.0 /100 | #312 | Tragic $71,452 |
| Immigrants | Bahamas | 0.0 /100 | #313 | Tragic $71,349 |
| Dominicans | 0.0 /100 | #314 | Tragic $71,302 |
| Ottawa | 0.0 /100 | #315 | Tragic $70,984 |
| Apache | 0.0 /100 | #316 | Tragic $70,927 |
| Cajuns | 0.0 /100 | #317 | Tragic $70,605 |
| Chippewa | 0.0 /100 | #318 | Tragic $70,539 |
| Immigrants | Dominican Republic | 0.0 /100 | #319 | Tragic $70,208 |
| Colville | 0.0 /100 | #320 | Tragic $70,094 |
Demographics Similar to Immigrants from Europe by Median Household Income
In terms of median household income, the demographic groups most similar to Immigrants from Europe are Korean ($95,018, a difference of 0.020%), Laotian ($94,990, a difference of 0.040%), Soviet Union ($95,098, a difference of 0.070%), New Zealander ($95,146, a difference of 0.12%), and Immigrants from Norway ($94,846, a difference of 0.20%).
| Demographics | Rating | Rank | Median Household Income |
| Immigrants | South Africa | 99.9 /100 | #52 | Exceptional $95,800 |
| Paraguayans | 99.9 /100 | #53 | Exceptional $95,737 |
| Egyptians | 99.9 /100 | #54 | Exceptional $95,673 |
| Immigrants | Czechoslovakia | 99.9 /100 | #55 | Exceptional $95,319 |
| Immigrants | Austria | 99.9 /100 | #56 | Exceptional $95,277 |
| New Zealanders | 99.8 /100 | #57 | Exceptional $95,146 |
| Soviet Union | 99.8 /100 | #58 | Exceptional $95,098 |
| Immigrants | Europe | 99.8 /100 | #59 | Exceptional $95,032 |
| Koreans | 99.8 /100 | #60 | Exceptional $95,018 |
| Laotians | 99.8 /100 | #61 | Exceptional $94,990 |
| Immigrants | Norway | 99.8 /100 | #62 | Exceptional $94,846 |
| Greeks | 99.8 /100 | #63 | Exceptional $94,735 |
| Immigrants | Netherlands | 99.7 /100 | #64 | Exceptional $94,411 |
| Immigrants | Belarus | 99.7 /100 | #65 | Exceptional $94,399 |
| Immigrants | Romania | 99.7 /100 | #66 | Exceptional $94,222 |