Immigrants from Bahamas vs Immigrants from Europe Householder Income Over 65 years
COMPARE
Immigrants from Bahamas
Immigrants from Europe
Householder Income Over 65 years
Householder Income Over 65 years Comparison
Immigrants from Bahamas
Immigrants from Europe
$53,174
HOUSEHOLDER INCOME OVER 65 YEARS
0.0/ 100
METRIC RATING
300th/ 347
METRIC RANK
$64,828
HOUSEHOLDER INCOME OVER 65 YEARS
98.3/ 100
METRIC RATING
81st/ 347
METRIC RANK
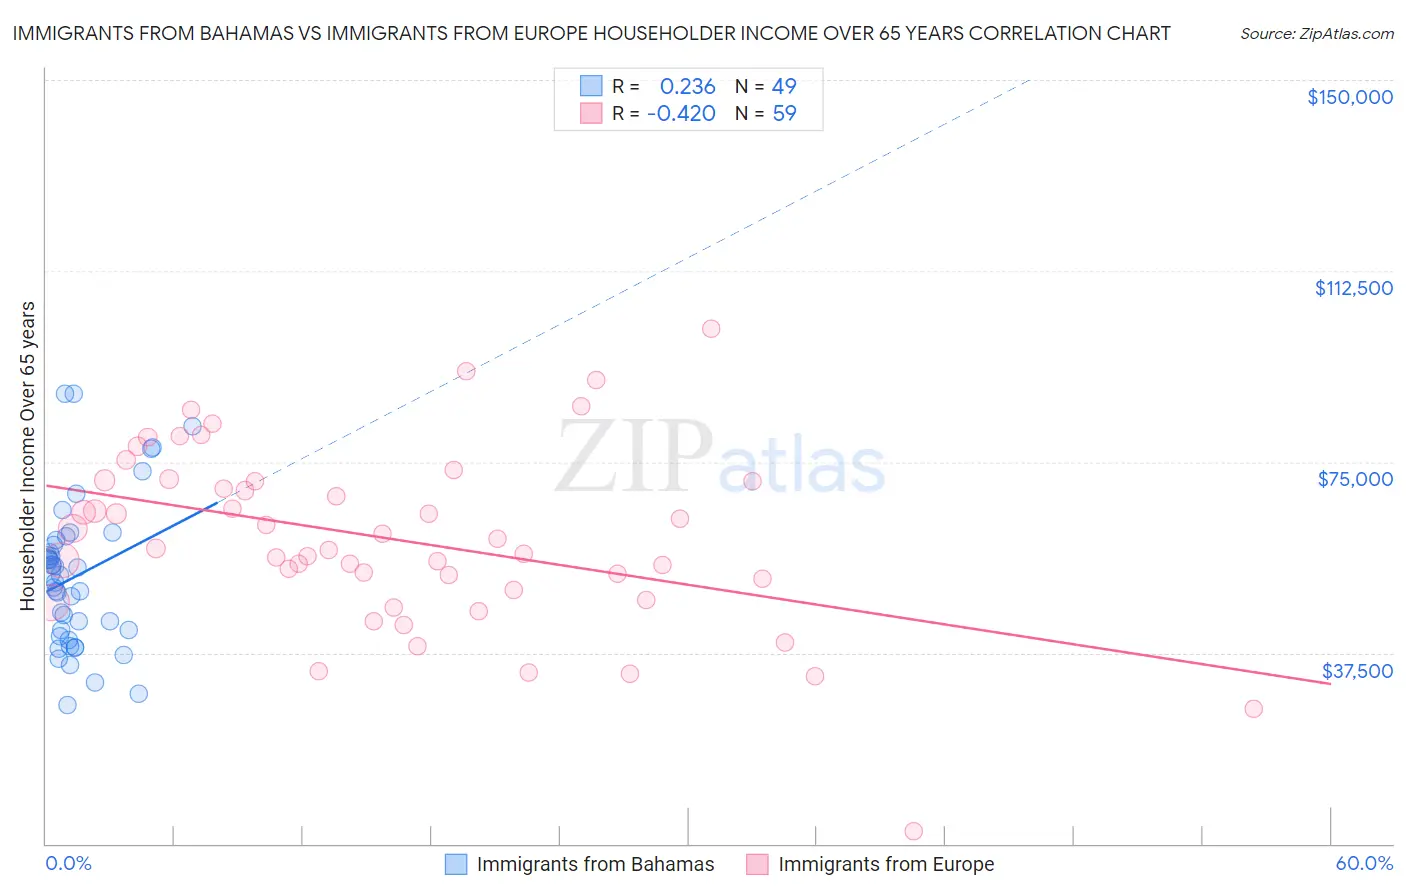
Immigrants from Bahamas vs Immigrants from Europe Householder Income Over 65 years Correlation Chart
The statistical analysis conducted on geographies consisting of 104,535,567 people shows a weak positive correlation between the proportion of Immigrants from Bahamas and household income with householder over the age of 65 in the United States with a correlation coefficient (R) of 0.236 and weighted average of $53,174. Similarly, the statistical analysis conducted on geographies consisting of 543,531,180 people shows a moderate negative correlation between the proportion of Immigrants from Europe and household income with householder over the age of 65 in the United States with a correlation coefficient (R) of -0.420 and weighted average of $64,828, a difference of 21.9%.
Householder Income Over 65 years Correlation Summary
| Measurement | Immigrants from Bahamas | Immigrants from Europe |
| Minimum | $27,353 | $2,499 |
| Maximum | $88,339 | $101,125 |
| Range | $60,986 | $98,626 |
| Mean | $52,591 | $59,739 |
| Median | $52,760 | $57,940 |
| Interquartile 25% (IQ1) | $41,261 | $49,904 |
| Interquartile 75% (IQ3) | $59,091 | $71,167 |
| Interquartile Range (IQR) | $17,831 | $21,263 |
| Standard Deviation (Sample) | $14,436 | $17,754 |
| Standard Deviation (Population) | $14,288 | $17,603 |
Similar Demographics by Householder Income Over 65 years
Demographics Similar to Immigrants from Bahamas by Householder Income Over 65 years
In terms of householder income over 65 years, the demographic groups most similar to Immigrants from Bahamas are Ottawa ($53,217, a difference of 0.080%), Central American Indian ($53,232, a difference of 0.11%), Yuman ($53,110, a difference of 0.12%), Immigrants from Latin America ($53,265, a difference of 0.17%), and Spanish American Indian ($53,077, a difference of 0.18%).
| Demographics | Rating | Rank | Householder Income Over 65 years |
| Immigrants | Belize | 0.0 /100 | #293 | Tragic $53,665 |
| Senegalese | 0.0 /100 | #294 | Tragic $53,591 |
| Immigrants | Central America | 0.0 /100 | #295 | Tragic $53,420 |
| Immigrants | Somalia | 0.0 /100 | #296 | Tragic $53,333 |
| Immigrants | Latin America | 0.0 /100 | #297 | Tragic $53,265 |
| Central American Indians | 0.0 /100 | #298 | Tragic $53,232 |
| Ottawa | 0.0 /100 | #299 | Tragic $53,217 |
| Immigrants | Bahamas | 0.0 /100 | #300 | Tragic $53,174 |
| Yuman | 0.0 /100 | #301 | Tragic $53,110 |
| Spanish American Indians | 0.0 /100 | #302 | Tragic $53,077 |
| Choctaw | 0.0 /100 | #303 | Tragic $53,060 |
| Ute | 0.0 /100 | #304 | Tragic $52,949 |
| Pueblo | 0.0 /100 | #305 | Tragic $52,930 |
| Pennsylvania Germans | 0.0 /100 | #306 | Tragic $52,888 |
| Hispanics or Latinos | 0.0 /100 | #307 | Tragic $52,832 |
Demographics Similar to Immigrants from Europe by Householder Income Over 65 years
In terms of householder income over 65 years, the demographic groups most similar to Immigrants from Europe are Immigrants from North America ($64,856, a difference of 0.040%), Immigrants from Fiji ($64,795, a difference of 0.050%), Hawaiian ($64,920, a difference of 0.14%), Immigrants from Western Europe ($64,933, a difference of 0.16%), and Immigrants from Canada ($64,952, a difference of 0.19%).
| Demographics | Rating | Rank | Householder Income Over 65 years |
| Lithuanians | 98.8 /100 | #74 | Exceptional $65,209 |
| Sierra Leoneans | 98.6 /100 | #75 | Exceptional $65,038 |
| Ethiopians | 98.5 /100 | #76 | Exceptional $64,989 |
| Immigrants | Canada | 98.5 /100 | #77 | Exceptional $64,952 |
| Immigrants | Western Europe | 98.5 /100 | #78 | Exceptional $64,933 |
| Hawaiians | 98.4 /100 | #79 | Exceptional $64,920 |
| Immigrants | North America | 98.3 /100 | #80 | Exceptional $64,856 |
| Immigrants | Europe | 98.3 /100 | #81 | Exceptional $64,828 |
| Immigrants | Fiji | 98.2 /100 | #82 | Exceptional $64,795 |
| Northern Europeans | 97.9 /100 | #83 | Exceptional $64,658 |
| Immigrants | Greece | 97.9 /100 | #84 | Exceptional $64,636 |
| Immigrants | Lebanon | 97.6 /100 | #85 | Exceptional $64,521 |
| Immigrants | Russia | 97.6 /100 | #86 | Exceptional $64,512 |
| Austrians | 97.5 /100 | #87 | Exceptional $64,470 |
| Immigrants | Romania | 97.5 /100 | #88 | Exceptional $64,462 |