Immigrants from Bahamas vs Immigrants from Europe In Labor Force | Age 20-64
COMPARE
Immigrants from Bahamas
Immigrants from Europe
In Labor Force | Age 20-64
In Labor Force | Age 20-64 Comparison
Immigrants from Bahamas
Immigrants from Europe
78.2%
IN LABOR FORCE | AGE 20-64
0.0/ 100
METRIC RATING
277th/ 347
METRIC RANK
79.9%
IN LABOR FORCE | AGE 20-64
91.6/ 100
METRIC RATING
124th/ 347
METRIC RANK
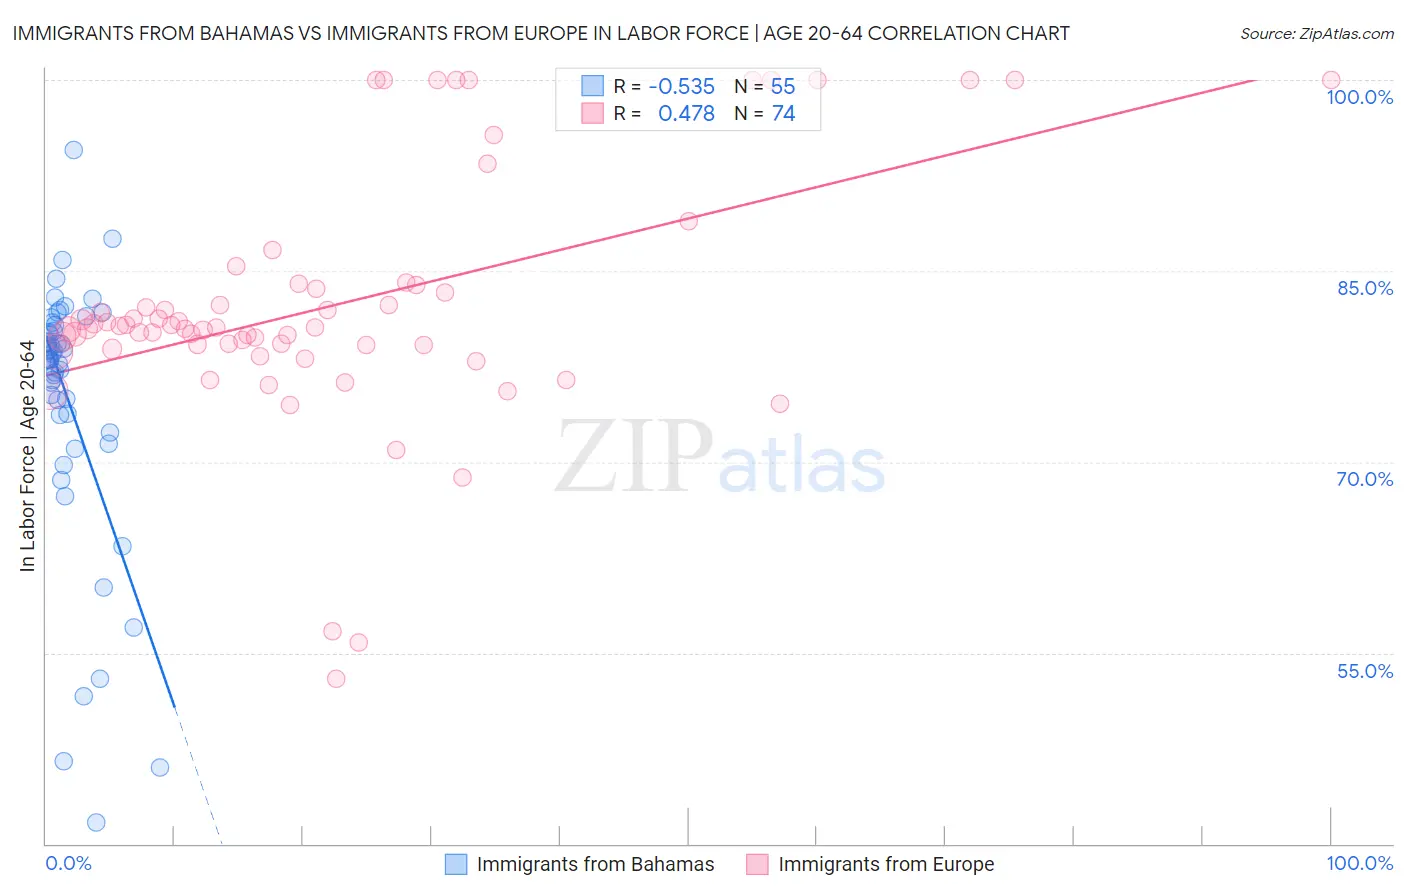
Immigrants from Bahamas vs Immigrants from Europe In Labor Force | Age 20-64 Correlation Chart
The statistical analysis conducted on geographies consisting of 104,666,072 people shows a substantial negative correlation between the proportion of Immigrants from Bahamas and labor force participation rate among population between the ages 20 and 64 in the United States with a correlation coefficient (R) of -0.535 and weighted average of 78.2%. Similarly, the statistical analysis conducted on geographies consisting of 547,427,342 people shows a moderate positive correlation between the proportion of Immigrants from Europe and labor force participation rate among population between the ages 20 and 64 in the United States with a correlation coefficient (R) of 0.478 and weighted average of 79.9%, a difference of 2.2%.
In Labor Force | Age 20-64 Correlation Summary
| Measurement | Immigrants from Bahamas | Immigrants from Europe |
| Minimum | 41.7% | 53.0% |
| Maximum | 94.5% | 100.0% |
| Range | 52.8% | 47.0% |
| Mean | 74.7% | 82.3% |
| Median | 78.0% | 80.5% |
| Interquartile 25% (IQ1) | 72.3% | 79.2% |
| Interquartile 75% (IQ3) | 80.8% | 83.9% |
| Interquartile Range (IQR) | 8.5% | 4.8% |
| Standard Deviation (Sample) | 10.7% | 9.7% |
| Standard Deviation (Population) | 10.6% | 9.7% |
Similar Demographics by In Labor Force | Age 20-64
Demographics Similar to Immigrants from Bahamas by In Labor Force | Age 20-64
In terms of in labor force | age 20-64, the demographic groups most similar to Immigrants from Bahamas are Mexican American Indian (78.2%, a difference of 0.0%), Puget Sound Salish (78.2%, a difference of 0.010%), Aleut (78.2%, a difference of 0.020%), Spanish (78.2%, a difference of 0.020%), and French American Indian (78.2%, a difference of 0.050%).
| Demographics | Rating | Rank | In Labor Force | Age 20-64 |
| Scotch-Irish | 0.0 /100 | #270 | Tragic 78.3% |
| Immigrants | Latin America | 0.0 /100 | #271 | Tragic 78.3% |
| Marshallese | 0.0 /100 | #272 | Tragic 78.3% |
| French American Indians | 0.0 /100 | #273 | Tragic 78.2% |
| Aleuts | 0.0 /100 | #274 | Tragic 78.2% |
| Spanish | 0.0 /100 | #275 | Tragic 78.2% |
| Puget Sound Salish | 0.0 /100 | #276 | Tragic 78.2% |
| Immigrants | Bahamas | 0.0 /100 | #277 | Tragic 78.2% |
| Mexican American Indians | 0.0 /100 | #278 | Tragic 78.2% |
| Belizeans | 0.0 /100 | #279 | Tragic 78.2% |
| Immigrants | Dominica | 0.0 /100 | #280 | Tragic 78.1% |
| Guyanese | 0.0 /100 | #281 | Tragic 78.1% |
| Immigrants | St. Vincent and the Grenadines | 0.0 /100 | #282 | Tragic 78.1% |
| Immigrants | Nonimmigrants | 0.0 /100 | #283 | Tragic 78.1% |
| Immigrants | Guyana | 0.0 /100 | #284 | Tragic 78.1% |
Demographics Similar to Immigrants from Europe by In Labor Force | Age 20-64
In terms of in labor force | age 20-64, the demographic groups most similar to Immigrants from Europe are Immigrants from Russia (79.9%, a difference of 0.0%), Danish (79.9%, a difference of 0.0%), Mongolian (79.9%, a difference of 0.010%), Immigrants from Taiwan (80.0%, a difference of 0.020%), and Maltese (80.0%, a difference of 0.020%).
| Demographics | Rating | Rank | In Labor Force | Age 20-64 |
| Immigrants | Vietnam | 92.7 /100 | #117 | Exceptional 80.0% |
| Cape Verdeans | 92.7 /100 | #118 | Exceptional 80.0% |
| Immigrants | Taiwan | 92.5 /100 | #119 | Exceptional 80.0% |
| Maltese | 92.4 /100 | #120 | Exceptional 80.0% |
| Immigrants | Kuwait | 92.2 /100 | #121 | Exceptional 80.0% |
| Mongolians | 92.0 /100 | #122 | Exceptional 79.9% |
| Immigrants | Russia | 91.8 /100 | #123 | Exceptional 79.9% |
| Immigrants | Europe | 91.6 /100 | #124 | Exceptional 79.9% |
| Danes | 91.5 /100 | #125 | Exceptional 79.9% |
| Immigrants | France | 90.7 /100 | #126 | Exceptional 79.9% |
| Immigrants | Czechoslovakia | 89.7 /100 | #127 | Excellent 79.9% |
| Immigrants | Eastern Asia | 89.4 /100 | #128 | Excellent 79.9% |
| Italians | 88.9 /100 | #129 | Excellent 79.9% |
| Immigrants | Zaire | 88.6 /100 | #130 | Excellent 79.9% |
| Immigrants | Iran | 88.3 /100 | #131 | Excellent 79.9% |