Cypriot vs Immigrants from Europe Poverty
COMPARE
Cypriot
Immigrants from Europe
Poverty
Poverty Comparison
Cypriots
Immigrants from Europe
10.8%
POVERTY
99.3/ 100
METRIC RATING
36th/ 347
METRIC RANK
11.2%
POVERTY
98.0/ 100
METRIC RATING
59th/ 347
METRIC RANK
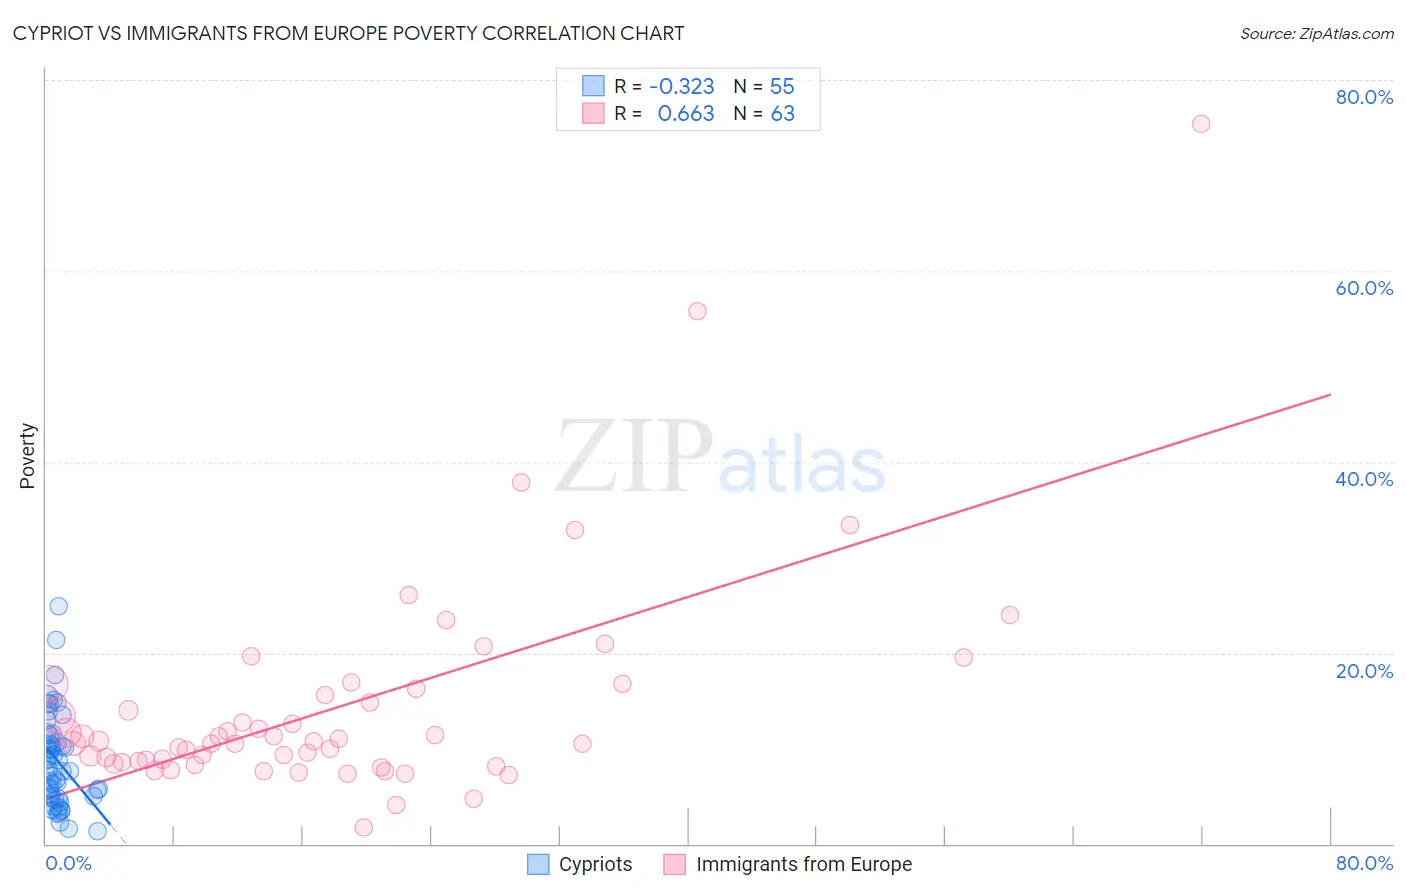
Cypriot vs Immigrants from Europe Poverty Correlation Chart
The statistical analysis conducted on geographies consisting of 61,850,194 people shows a mild negative correlation between the proportion of Cypriots and poverty level in the United States with a correlation coefficient (R) of -0.323 and weighted average of 10.8%. Similarly, the statistical analysis conducted on geographies consisting of 546,769,385 people shows a significant positive correlation between the proportion of Immigrants from Europe and poverty level in the United States with a correlation coefficient (R) of 0.663 and weighted average of 11.2%, a difference of 3.0%.
Poverty Correlation Summary
| Measurement | Cypriot | Immigrants from Europe |
| Minimum | 1.4% | 1.7% |
| Maximum | 24.8% | 75.4% |
| Range | 23.5% | 73.7% |
| Mean | 8.7% | 14.4% |
| Median | 7.7% | 10.7% |
| Interquartile 25% (IQ1) | 4.9% | 8.6% |
| Interquartile 75% (IQ3) | 11.4% | 16.3% |
| Interquartile Range (IQR) | 6.5% | 7.7% |
| Standard Deviation (Sample) | 4.9% | 11.7% |
| Standard Deviation (Population) | 4.9% | 11.6% |
Similar Demographics by Poverty
Demographics Similar to Cypriots by Poverty
In terms of poverty, the demographic groups most similar to Cypriots are Tongan (10.8%, a difference of 0.080%), Immigrants from Greece (10.8%, a difference of 0.10%), Immigrants from Poland (10.8%, a difference of 0.12%), Czech (10.8%, a difference of 0.14%), and Macedonian (10.8%, a difference of 0.21%).
| Demographics | Rating | Rank | Poverty |
| Greeks | 99.5 /100 | #29 | Exceptional 10.7% |
| Danes | 99.5 /100 | #30 | Exceptional 10.7% |
| Poles | 99.5 /100 | #31 | Exceptional 10.7% |
| Iranians | 99.5 /100 | #32 | Exceptional 10.7% |
| Macedonians | 99.4 /100 | #33 | Exceptional 10.8% |
| Immigrants | Poland | 99.4 /100 | #34 | Exceptional 10.8% |
| Tongans | 99.4 /100 | #35 | Exceptional 10.8% |
| Cypriots | 99.3 /100 | #36 | Exceptional 10.8% |
| Immigrants | Greece | 99.3 /100 | #37 | Exceptional 10.8% |
| Czechs | 99.3 /100 | #38 | Exceptional 10.8% |
| Immigrants | Pakistan | 99.3 /100 | #39 | Exceptional 10.8% |
| Russians | 99.3 /100 | #40 | Exceptional 10.9% |
| Immigrants | Iran | 99.2 /100 | #41 | Exceptional 10.9% |
| Koreans | 99.2 /100 | #42 | Exceptional 10.9% |
| Immigrants | Singapore | 99.2 /100 | #43 | Exceptional 10.9% |
Demographics Similar to Immigrants from Europe by Poverty
In terms of poverty, the demographic groups most similar to Immigrants from Europe are German (11.1%, a difference of 0.15%), Immigrants from Sri Lanka (11.2%, a difference of 0.16%), Scandinavian (11.1%, a difference of 0.21%), Immigrants from Italy (11.2%, a difference of 0.22%), and Estonian (11.1%, a difference of 0.25%).
| Demographics | Rating | Rank | Poverty |
| Immigrants | Philippines | 98.7 /100 | #52 | Exceptional 11.0% |
| Immigrants | Austria | 98.6 /100 | #53 | Exceptional 11.1% |
| Immigrants | Bulgaria | 98.5 /100 | #54 | Exceptional 11.1% |
| Immigrants | Serbia | 98.5 /100 | #55 | Exceptional 11.1% |
| Estonians | 98.2 /100 | #56 | Exceptional 11.1% |
| Scandinavians | 98.2 /100 | #57 | Exceptional 11.1% |
| Germans | 98.1 /100 | #58 | Exceptional 11.1% |
| Immigrants | Europe | 98.0 /100 | #59 | Exceptional 11.2% |
| Immigrants | Sri Lanka | 97.9 /100 | #60 | Exceptional 11.2% |
| Immigrants | Italy | 97.9 /100 | #61 | Exceptional 11.2% |
| Austrians | 97.8 /100 | #62 | Exceptional 11.2% |
| Ukrainians | 97.8 /100 | #63 | Exceptional 11.2% |
| Swiss | 97.7 /100 | #64 | Exceptional 11.2% |
| Immigrants | Asia | 97.5 /100 | #65 | Exceptional 11.2% |
| Immigrants | Netherlands | 97.5 /100 | #66 | Exceptional 11.2% |