Hungarian vs Immigrants from Sudan 9th Grade
COMPARE
Hungarian
Immigrants from Sudan
9th Grade
9th Grade Comparison
Hungarians
Immigrants from Sudan
96.2%
9TH GRADE
100.0/ 100
METRIC RATING
34th/ 347
METRIC RANK
94.6%
9TH GRADE
17.6/ 100
METRIC RATING
205th/ 347
METRIC RANK
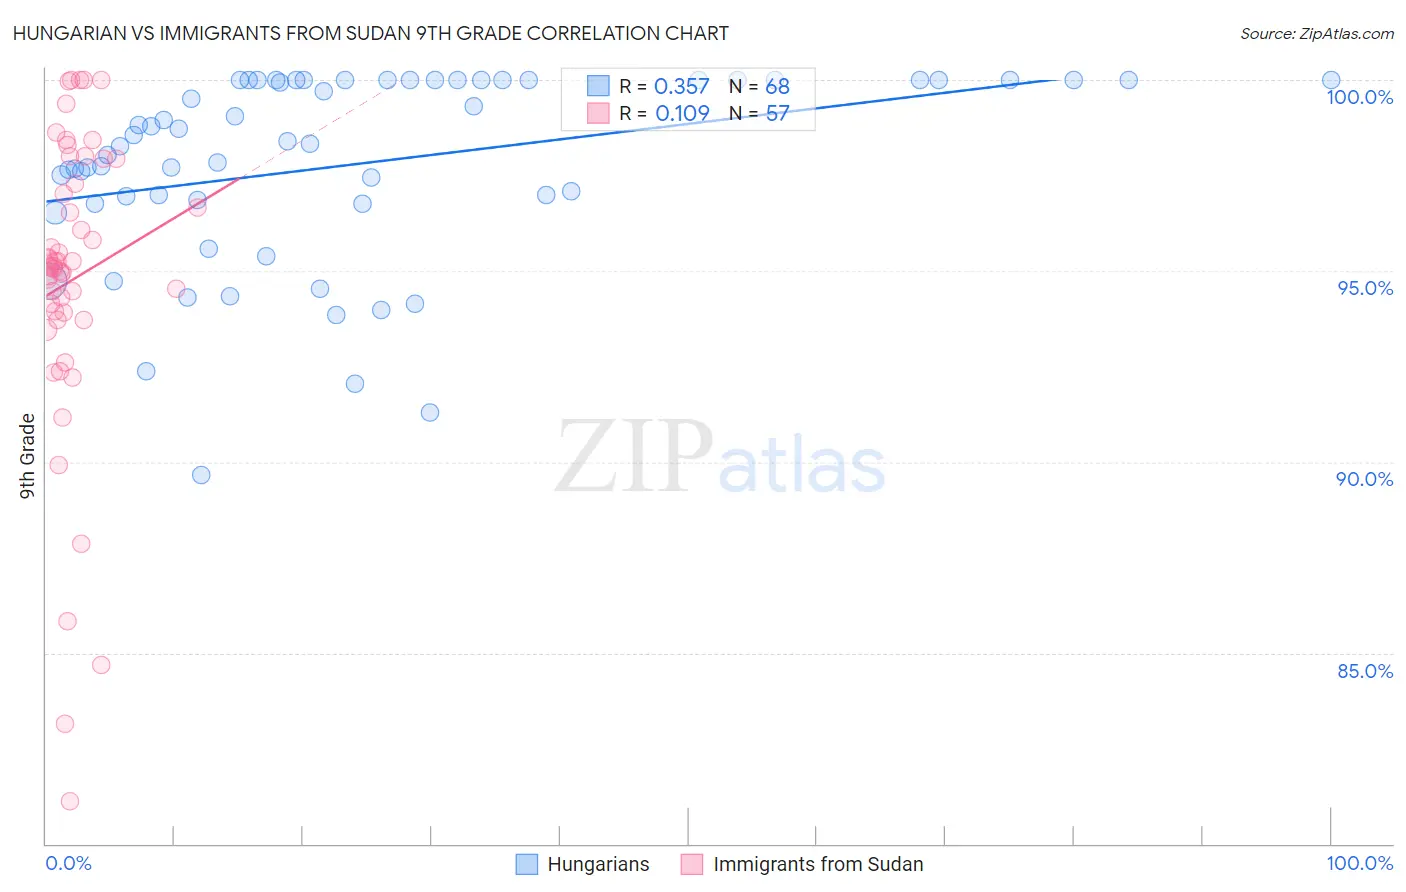
Hungarian vs Immigrants from Sudan 9th Grade Correlation Chart
The statistical analysis conducted on geographies consisting of 486,239,439 people shows a mild positive correlation between the proportion of Hungarians and percentage of population with at least 9th grade education in the United States with a correlation coefficient (R) of 0.357 and weighted average of 96.2%. Similarly, the statistical analysis conducted on geographies consisting of 118,959,807 people shows a poor positive correlation between the proportion of Immigrants from Sudan and percentage of population with at least 9th grade education in the United States with a correlation coefficient (R) of 0.109 and weighted average of 94.6%, a difference of 1.7%.
9th Grade Correlation Summary
| Measurement | Hungarian | Immigrants from Sudan |
| Minimum | 89.7% | 81.1% |
| Maximum | 100.0% | 100.0% |
| Range | 10.3% | 18.9% |
| Mean | 97.8% | 94.8% |
| Median | 98.4% | 95.1% |
| Interquartile 25% (IQ1) | 96.8% | 93.8% |
| Interquartile 75% (IQ3) | 100.0% | 97.6% |
| Interquartile Range (IQR) | 3.2% | 3.8% |
| Standard Deviation (Sample) | 2.5% | 4.0% |
| Standard Deviation (Population) | 2.5% | 4.0% |
Similar Demographics by 9th Grade
Demographics Similar to Hungarians by 9th Grade
In terms of 9th grade, the demographic groups most similar to Hungarians are Luxembourger (96.3%, a difference of 0.030%), British (96.3%, a difference of 0.040%), Belgian (96.3%, a difference of 0.040%), Bulgarian (96.2%, a difference of 0.040%), and Northern European (96.2%, a difference of 0.040%).
| Demographics | Rating | Rank | 9th Grade |
| Scotch-Irish | 100.0 /100 | #27 | Exceptional 96.3% |
| Eastern Europeans | 100.0 /100 | #28 | Exceptional 96.3% |
| Chinese | 100.0 /100 | #29 | Exceptional 96.3% |
| Maltese | 100.0 /100 | #30 | Exceptional 96.3% |
| British | 100.0 /100 | #31 | Exceptional 96.3% |
| Belgians | 100.0 /100 | #32 | Exceptional 96.3% |
| Luxembourgers | 100.0 /100 | #33 | Exceptional 96.3% |
| Hungarians | 100.0 /100 | #34 | Exceptional 96.2% |
| Bulgarians | 99.9 /100 | #35 | Exceptional 96.2% |
| Northern Europeans | 99.9 /100 | #36 | Exceptional 96.2% |
| Estonians | 99.9 /100 | #37 | Exceptional 96.1% |
| Immigrants | Scotland | 99.9 /100 | #38 | Exceptional 96.1% |
| Ottawa | 99.9 /100 | #39 | Exceptional 96.1% |
| Slavs | 99.9 /100 | #40 | Exceptional 96.1% |
| Czechoslovakians | 99.9 /100 | #41 | Exceptional 96.1% |
Demographics Similar to Immigrants from Sudan by 9th Grade
In terms of 9th grade, the demographic groups most similar to Immigrants from Sudan are Samoan (94.6%, a difference of 0.0%), Moroccan (94.6%, a difference of 0.020%), Immigrants from Morocco (94.6%, a difference of 0.020%), Immigrants from Zaire (94.6%, a difference of 0.030%), and Black/African American (94.6%, a difference of 0.030%).
| Demographics | Rating | Rank | 9th Grade |
| Hawaiians | 22.7 /100 | #198 | Fair 94.7% |
| Laotians | 21.0 /100 | #199 | Fair 94.6% |
| Immigrants | Zaire | 20.6 /100 | #200 | Fair 94.6% |
| Blacks/African Americans | 20.5 /100 | #201 | Fair 94.6% |
| Immigrants | Eastern Asia | 19.8 /100 | #202 | Poor 94.6% |
| Immigrants | Bahamas | 19.8 /100 | #203 | Poor 94.6% |
| Moroccans | 19.6 /100 | #204 | Poor 94.6% |
| Immigrants | Sudan | 17.6 /100 | #205 | Poor 94.6% |
| Samoans | 17.3 /100 | #206 | Poor 94.6% |
| Immigrants | Morocco | 16.3 /100 | #207 | Poor 94.6% |
| Immigrants | Pakistan | 15.5 /100 | #208 | Poor 94.6% |
| Comanche | 14.9 /100 | #209 | Poor 94.6% |
| Immigrants | Chile | 13.4 /100 | #210 | Poor 94.5% |
| Immigrants | Indonesia | 12.3 /100 | #211 | Poor 94.5% |
| Immigrants | Malaysia | 12.2 /100 | #212 | Poor 94.5% |