Hungarian vs Immigrants from Somalia Female Poverty
COMPARE
Hungarian
Immigrants from Somalia
Female Poverty
Female Poverty Comparison
Hungarians
Immigrants from Somalia
13.2%
FEMALE POVERTY
70.1/ 100
METRIC RATING
155th/ 347
METRIC RANK
17.0%
FEMALE POVERTY
0.0/ 100
METRIC RATING
312th/ 347
METRIC RANK
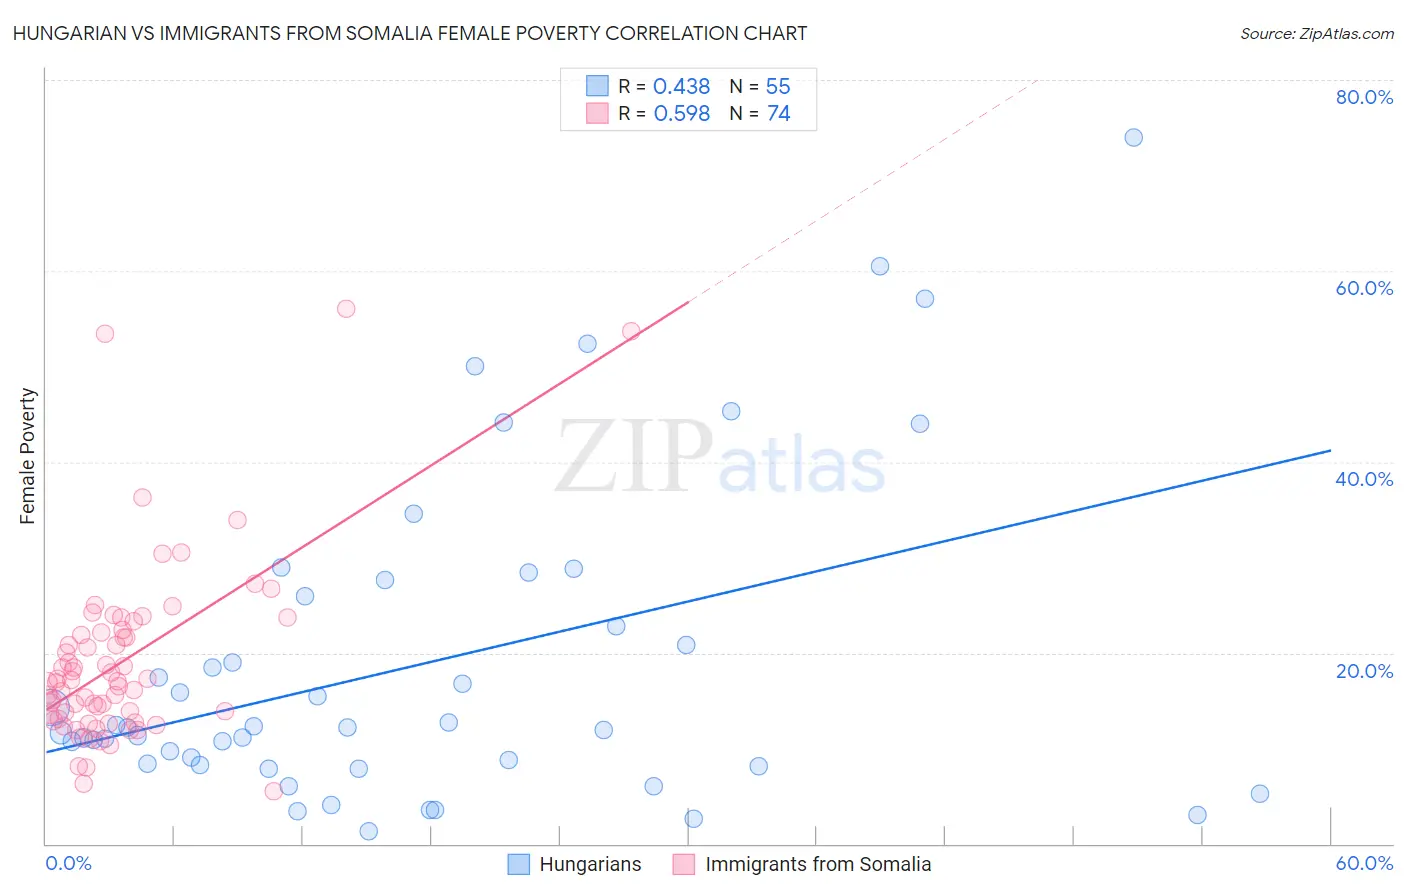
Hungarian vs Immigrants from Somalia Female Poverty Correlation Chart
The statistical analysis conducted on geographies consisting of 485,692,155 people shows a moderate positive correlation between the proportion of Hungarians and poverty level among females in the United States with a correlation coefficient (R) of 0.438 and weighted average of 13.2%. Similarly, the statistical analysis conducted on geographies consisting of 92,101,870 people shows a substantial positive correlation between the proportion of Immigrants from Somalia and poverty level among females in the United States with a correlation coefficient (R) of 0.598 and weighted average of 17.0%, a difference of 29.3%.
Female Poverty Correlation Summary
| Measurement | Hungarian | Immigrants from Somalia |
| Minimum | 1.3% | 5.5% |
| Maximum | 73.9% | 56.1% |
| Range | 72.6% | 50.6% |
| Mean | 18.8% | 19.1% |
| Median | 12.1% | 17.0% |
| Interquartile 25% (IQ1) | 8.2% | 13.1% |
| Interquartile 75% (IQ3) | 26.0% | 22.1% |
| Interquartile Range (IQR) | 17.7% | 9.1% |
| Standard Deviation (Sample) | 16.6% | 9.5% |
| Standard Deviation (Population) | 16.5% | 9.4% |
Similar Demographics by Female Poverty
Demographics Similar to Hungarians by Female Poverty
In terms of female poverty, the demographic groups most similar to Hungarians are Armenian (13.2%, a difference of 0.040%), Immigrants from Bosnia and Herzegovina (13.2%, a difference of 0.050%), Immigrants from Fiji (13.2%, a difference of 0.10%), Immigrants from Northern Africa (13.2%, a difference of 0.15%), and Pennsylvania German (13.2%, a difference of 0.32%).
| Demographics | Rating | Rank | Female Poverty |
| Yugoslavians | 76.9 /100 | #148 | Good 13.1% |
| Taiwanese | 75.7 /100 | #149 | Good 13.1% |
| Tsimshian | 75.5 /100 | #150 | Good 13.1% |
| Immigrants | Germany | 74.9 /100 | #151 | Good 13.1% |
| Samoans | 73.6 /100 | #152 | Good 13.1% |
| Immigrants | Fiji | 71.0 /100 | #153 | Good 13.2% |
| Armenians | 70.4 /100 | #154 | Good 13.2% |
| Hungarians | 70.1 /100 | #155 | Good 13.2% |
| Immigrants | Bosnia and Herzegovina | 69.7 /100 | #156 | Good 13.2% |
| Immigrants | Northern Africa | 68.8 /100 | #157 | Good 13.2% |
| Pennsylvania Germans | 67.3 /100 | #158 | Good 13.2% |
| Costa Ricans | 63.6 /100 | #159 | Good 13.3% |
| Immigrants | Nepal | 62.7 /100 | #160 | Good 13.3% |
| Immigrants | Ethiopia | 62.5 /100 | #161 | Good 13.3% |
| Guamanians/Chamorros | 62.4 /100 | #162 | Good 13.3% |
Demographics Similar to Immigrants from Somalia by Female Poverty
In terms of female poverty, the demographic groups most similar to Immigrants from Somalia are British West Indian (17.0%, a difference of 0.080%), Immigrants from Guatemala (17.0%, a difference of 0.090%), Creek (17.0%, a difference of 0.10%), Dutch West Indian (17.1%, a difference of 0.33%), and Immigrants from Mexico (17.0%, a difference of 0.34%).
| Demographics | Rating | Rank | Female Poverty |
| Immigrants | Grenada | 0.0 /100 | #305 | Tragic 16.8% |
| Immigrants | Caribbean | 0.0 /100 | #306 | Tragic 16.9% |
| Seminole | 0.0 /100 | #307 | Tragic 16.9% |
| Africans | 0.0 /100 | #308 | Tragic 16.9% |
| Immigrants | Mexico | 0.0 /100 | #309 | Tragic 17.0% |
| Creek | 0.0 /100 | #310 | Tragic 17.0% |
| Immigrants | Guatemala | 0.0 /100 | #311 | Tragic 17.0% |
| Immigrants | Somalia | 0.0 /100 | #312 | Tragic 17.0% |
| British West Indians | 0.0 /100 | #313 | Tragic 17.0% |
| Dutch West Indians | 0.0 /100 | #314 | Tragic 17.1% |
| U.S. Virgin Islanders | 0.0 /100 | #315 | Tragic 17.3% |
| Hondurans | 0.0 /100 | #316 | Tragic 17.4% |
| Immigrants | Congo | 0.0 /100 | #317 | Tragic 17.4% |
| Ute | 0.0 /100 | #318 | Tragic 17.5% |
| Cajuns | 0.0 /100 | #319 | Tragic 17.5% |