Houma vs Immigrants from Zaire Receiving Food Stamps
COMPARE
Houma
Immigrants from Zaire
Receiving Food Stamps
Receiving Food Stamps Comparison
Houma
Immigrants from Zaire
16.5%
RECEIVING FOOD STAMPS
0.0/ 100
METRIC RATING
307th/ 347
METRIC RANK
13.4%
RECEIVING FOOD STAMPS
1.9/ 100
METRIC RATING
235th/ 347
METRIC RANK
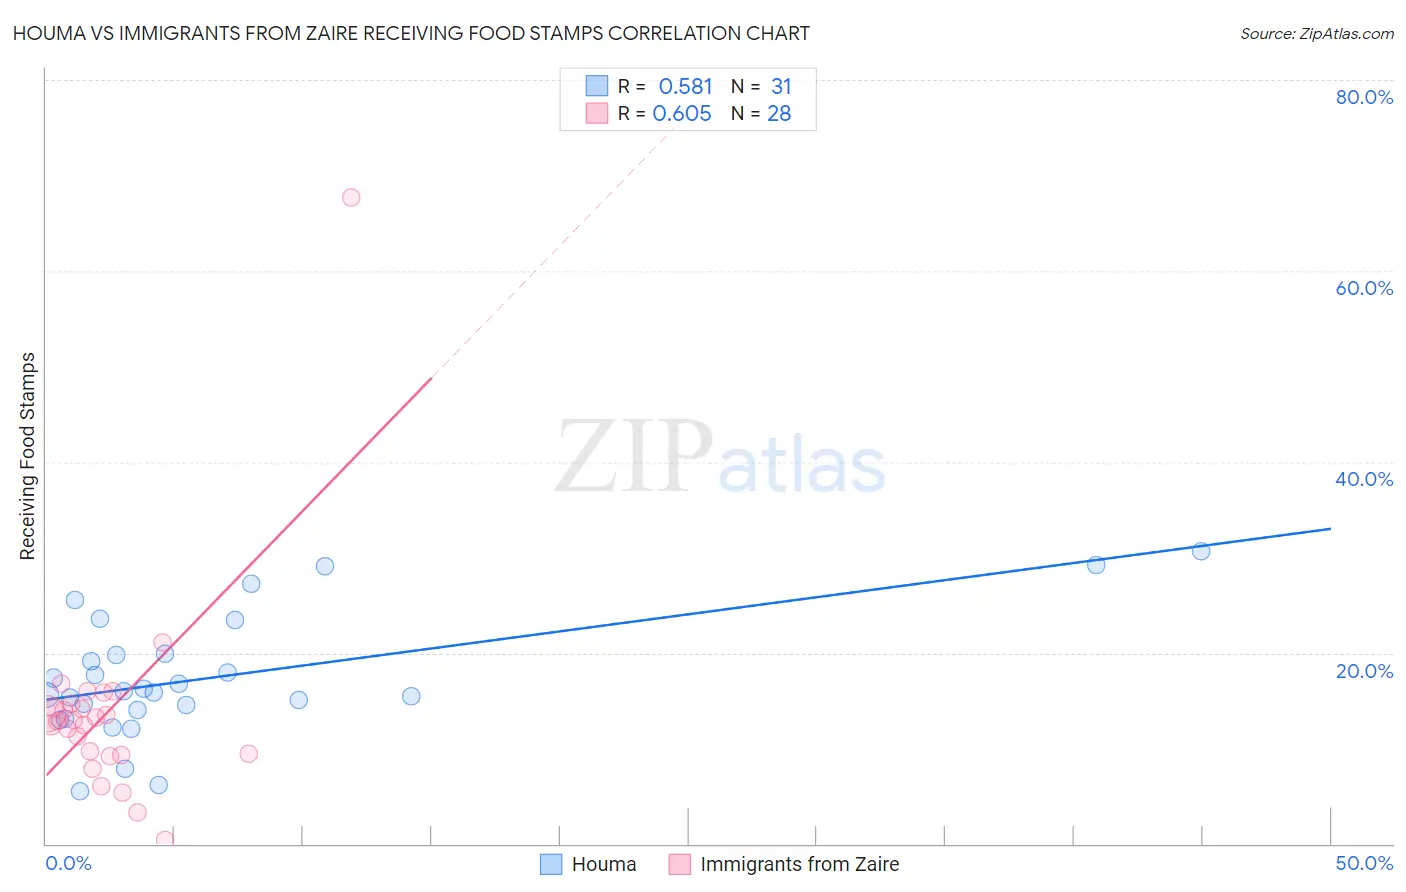
Houma vs Immigrants from Zaire Receiving Food Stamps Correlation Chart
The statistical analysis conducted on geographies consisting of 36,773,946 people shows a substantial positive correlation between the proportion of Houma and percentage of population receiving government assistance and/or food stamps in the United States with a correlation coefficient (R) of 0.581 and weighted average of 16.5%. Similarly, the statistical analysis conducted on geographies consisting of 107,223,376 people shows a significant positive correlation between the proportion of Immigrants from Zaire and percentage of population receiving government assistance and/or food stamps in the United States with a correlation coefficient (R) of 0.605 and weighted average of 13.4%, a difference of 23.1%.
Receiving Food Stamps Correlation Summary
| Measurement | Houma | Immigrants from Zaire |
| Minimum | 5.5% | 0.40% |
| Maximum | 30.6% | 67.7% |
| Range | 25.1% | 67.3% |
| Mean | 17.4% | 13.7% |
| Median | 16.0% | 12.9% |
| Interquartile 25% (IQ1) | 14.0% | 9.3% |
| Interquartile 75% (IQ3) | 19.9% | 14.5% |
| Interquartile Range (IQR) | 5.9% | 5.1% |
| Standard Deviation (Sample) | 6.3% | 11.4% |
| Standard Deviation (Population) | 6.2% | 11.2% |
Similar Demographics by Receiving Food Stamps
Demographics Similar to Houma by Receiving Food Stamps
In terms of receiving food stamps, the demographic groups most similar to Houma are Barbadian (16.5%, a difference of 0.26%), Jamaican (16.4%, a difference of 0.29%), Immigrants from the Azores (16.4%, a difference of 0.35%), U.S. Virgin Islander (16.5%, a difference of 0.50%), and Immigrants from Barbados (16.6%, a difference of 1.1%).
| Demographics | Rating | Rank | Receiving Food Stamps |
| Immigrants | Bangladesh | 0.0 /100 | #300 | Tragic 15.9% |
| Trinidadians and Tobagonians | 0.0 /100 | #301 | Tragic 16.0% |
| Immigrants | West Indies | 0.0 /100 | #302 | Tragic 16.1% |
| Nicaraguans | 0.0 /100 | #303 | Tragic 16.1% |
| West Indians | 0.0 /100 | #304 | Tragic 16.3% |
| Immigrants | Azores | 0.0 /100 | #305 | Tragic 16.4% |
| Jamaicans | 0.0 /100 | #306 | Tragic 16.4% |
| Houma | 0.0 /100 | #307 | Tragic 16.5% |
| Barbadians | 0.0 /100 | #308 | Tragic 16.5% |
| U.S. Virgin Islanders | 0.0 /100 | #309 | Tragic 16.5% |
| Immigrants | Barbados | 0.0 /100 | #310 | Tragic 16.6% |
| Guyanese | 0.0 /100 | #311 | Tragic 16.7% |
| Sioux | 0.0 /100 | #312 | Tragic 16.8% |
| Immigrants | Jamaica | 0.0 /100 | #313 | Tragic 16.9% |
| Immigrants | Guyana | 0.0 /100 | #314 | Tragic 16.9% |
Demographics Similar to Immigrants from Zaire by Receiving Food Stamps
In terms of receiving food stamps, the demographic groups most similar to Immigrants from Zaire are Crow (13.4%, a difference of 0.44%), Immigrants from El Salvador (13.5%, a difference of 0.67%), Comanche (13.3%, a difference of 0.77%), French American Indian (13.5%, a difference of 0.87%), and Cherokee (13.2%, a difference of 0.90%).
| Demographics | Rating | Rank | Receiving Food Stamps |
| Panamanians | 3.5 /100 | #228 | Tragic 13.1% |
| Ottawa | 3.5 /100 | #229 | Tragic 13.1% |
| Puget Sound Salish | 3.4 /100 | #230 | Tragic 13.1% |
| Immigrants | Nigeria | 3.4 /100 | #231 | Tragic 13.1% |
| Salvadorans | 2.7 /100 | #232 | Tragic 13.2% |
| Cherokee | 2.5 /100 | #233 | Tragic 13.2% |
| Comanche | 2.4 /100 | #234 | Tragic 13.3% |
| Immigrants | Zaire | 1.9 /100 | #235 | Tragic 13.4% |
| Crow | 1.6 /100 | #236 | Tragic 13.4% |
| Immigrants | El Salvador | 1.5 /100 | #237 | Tragic 13.5% |
| French American Indians | 1.4 /100 | #238 | Tragic 13.5% |
| Immigrants | Micronesia | 1.3 /100 | #239 | Tragic 13.5% |
| Iroquois | 1.2 /100 | #240 | Tragic 13.5% |
| Choctaw | 1.0 /100 | #241 | Tragic 13.6% |
| Immigrants | Panama | 1.0 /100 | #242 | Tragic 13.6% |