Houma vs Immigrants from Lithuania Single Male Poverty
COMPARE
Houma
Immigrants from Lithuania
Single Male Poverty
Single Male Poverty Comparison
Houma
Immigrants from Lithuania
23.5%
SINGLE MALE POVERTY
0.0/ 100
METRIC RATING
342nd/ 347
METRIC RANK
11.6%
SINGLE MALE POVERTY
99.9/ 100
METRIC RATING
50th/ 347
METRIC RANK
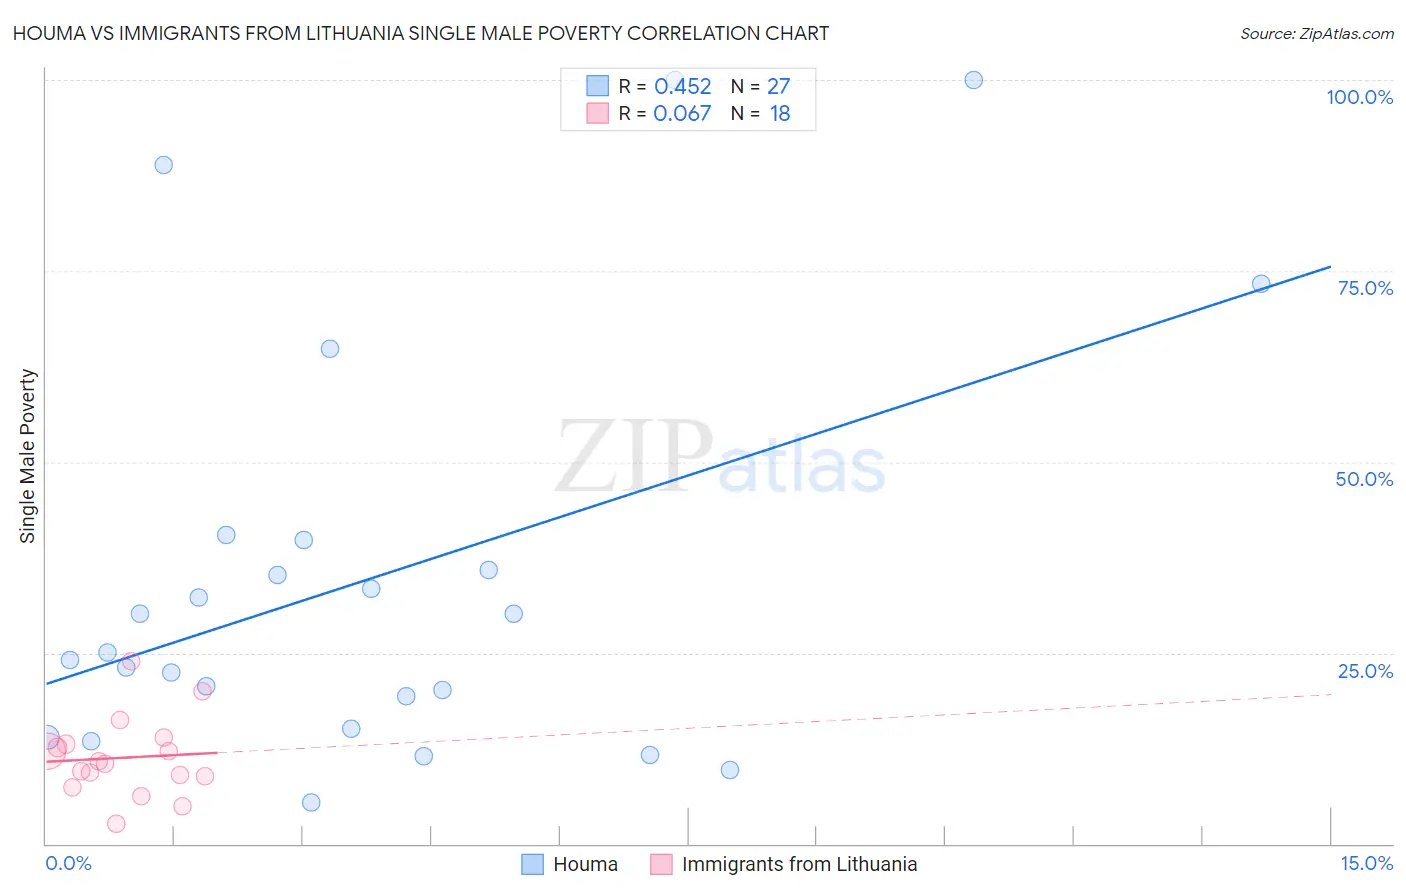
Houma vs Immigrants from Lithuania Single Male Poverty Correlation Chart
The statistical analysis conducted on geographies consisting of 35,894,228 people shows a moderate positive correlation between the proportion of Houma and poverty level among single males in the United States with a correlation coefficient (R) of 0.452 and weighted average of 23.5%. Similarly, the statistical analysis conducted on geographies consisting of 108,687,768 people shows a slight positive correlation between the proportion of Immigrants from Lithuania and poverty level among single males in the United States with a correlation coefficient (R) of 0.067 and weighted average of 11.6%, a difference of 102.1%.
Single Male Poverty Correlation Summary
| Measurement | Houma | Immigrants from Lithuania |
| Minimum | 5.4% | 2.6% |
| Maximum | 100.0% | 23.9% |
| Range | 94.6% | 21.3% |
| Mean | 34.8% | 11.3% |
| Median | 25.0% | 10.7% |
| Interquartile 25% (IQ1) | 15.1% | 8.9% |
| Interquartile 75% (IQ3) | 39.7% | 13.0% |
| Interquartile Range (IQR) | 24.7% | 4.2% |
| Standard Deviation (Sample) | 27.0% | 5.1% |
| Standard Deviation (Population) | 26.5% | 5.0% |
Similar Demographics by Single Male Poverty
Demographics Similar to Houma by Single Male Poverty
In terms of single male poverty, the demographic groups most similar to Houma are Crow (23.3%, a difference of 0.82%), Sioux (22.2%, a difference of 5.6%), Arapaho (21.9%, a difference of 6.9%), Puerto Rican (25.1%, a difference of 6.9%), and Lumbee (25.2%, a difference of 7.3%).
| Demographics | Rating | Rank | Single Male Poverty |
| Inupiat | 0.0 /100 | #333 | Tragic 20.0% |
| Pima | 0.0 /100 | #334 | Tragic 20.2% |
| Yuman | 0.0 /100 | #335 | Tragic 21.3% |
| Tohono O'odham | 0.0 /100 | #336 | Tragic 21.6% |
| Apache | 0.0 /100 | #337 | Tragic 21.6% |
| Pueblo | 0.0 /100 | #338 | Tragic 21.6% |
| Arapaho | 0.0 /100 | #339 | Tragic 21.9% |
| Sioux | 0.0 /100 | #340 | Tragic 22.2% |
| Crow | 0.0 /100 | #341 | Tragic 23.3% |
| Houma | 0.0 /100 | #342 | Tragic 23.5% |
| Puerto Ricans | 0.0 /100 | #343 | Tragic 25.1% |
| Lumbee | 0.0 /100 | #344 | Tragic 25.2% |
| Navajo | 0.0 /100 | #345 | Tragic 25.3% |
| Hopi | 0.0 /100 | #346 | Tragic 27.5% |
| Yup'ik | 0.0 /100 | #347 | Tragic 31.6% |
Demographics Similar to Immigrants from Lithuania by Single Male Poverty
In terms of single male poverty, the demographic groups most similar to Immigrants from Lithuania are Tlingit-Haida (11.6%, a difference of 0.060%), Immigrants from Indonesia (11.6%, a difference of 0.080%), Paraguayan (11.6%, a difference of 0.11%), Nepalese (11.6%, a difference of 0.15%), and Immigrants from Bulgaria (11.6%, a difference of 0.35%).
| Demographics | Rating | Rank | Single Male Poverty |
| Immigrants | Peru | 99.9 /100 | #43 | Exceptional 11.5% |
| Immigrants | Cameroon | 99.9 /100 | #44 | Exceptional 11.5% |
| Immigrants | Poland | 99.9 /100 | #45 | Exceptional 11.5% |
| Immigrants | Bulgaria | 99.9 /100 | #46 | Exceptional 11.6% |
| Nepalese | 99.9 /100 | #47 | Exceptional 11.6% |
| Immigrants | Indonesia | 99.9 /100 | #48 | Exceptional 11.6% |
| Tlingit-Haida | 99.9 /100 | #49 | Exceptional 11.6% |
| Immigrants | Lithuania | 99.9 /100 | #50 | Exceptional 11.6% |
| Paraguayans | 99.9 /100 | #51 | Exceptional 11.6% |
| Samoans | 99.9 /100 | #52 | Exceptional 11.7% |
| Bulgarians | 99.9 /100 | #53 | Exceptional 11.7% |
| Immigrants | Uzbekistan | 99.9 /100 | #54 | Exceptional 11.7% |
| Cypriots | 99.9 /100 | #55 | Exceptional 11.7% |
| Burmese | 99.8 /100 | #56 | Exceptional 11.7% |
| Immigrants | Romania | 99.8 /100 | #57 | Exceptional 11.7% |