Alsatian vs Immigrants from Lithuania Single Male Poverty
COMPARE
Alsatian
Immigrants from Lithuania
Single Male Poverty
Single Male Poverty Comparison
Alsatians
Immigrants from Lithuania
15.2%
SINGLE MALE POVERTY
0.0/ 100
METRIC RATING
302nd/ 347
METRIC RANK
11.6%
SINGLE MALE POVERTY
99.9/ 100
METRIC RATING
50th/ 347
METRIC RANK
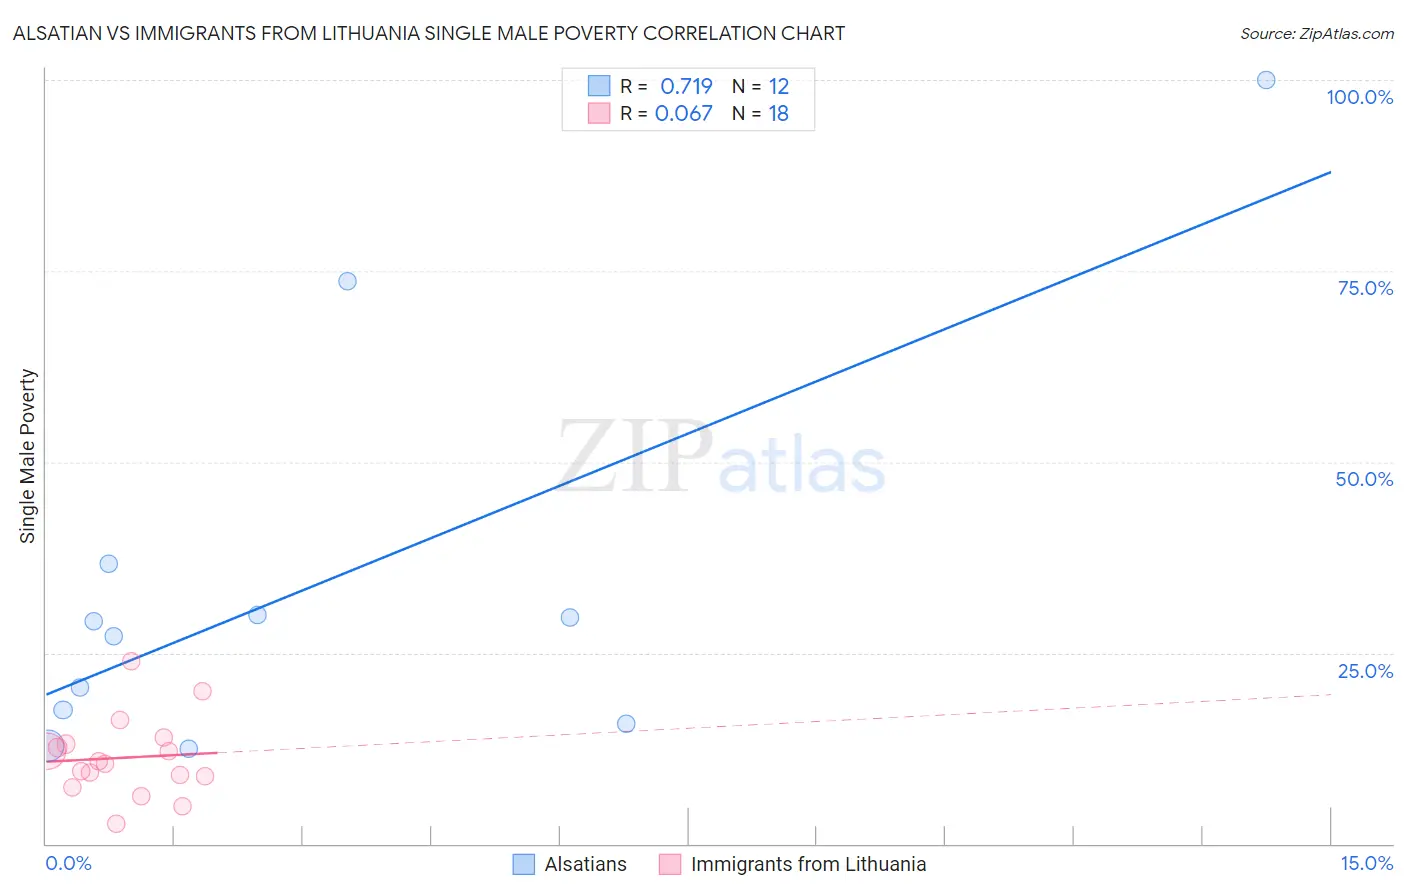
Alsatian vs Immigrants from Lithuania Single Male Poverty Correlation Chart
The statistical analysis conducted on geographies consisting of 78,244,917 people shows a strong positive correlation between the proportion of Alsatians and poverty level among single males in the United States with a correlation coefficient (R) of 0.719 and weighted average of 15.2%. Similarly, the statistical analysis conducted on geographies consisting of 108,687,768 people shows a slight positive correlation between the proportion of Immigrants from Lithuania and poverty level among single males in the United States with a correlation coefficient (R) of 0.067 and weighted average of 11.6%, a difference of 31.3%.
Single Male Poverty Correlation Summary
| Measurement | Alsatian | Immigrants from Lithuania |
| Minimum | 12.5% | 2.6% |
| Maximum | 100.0% | 23.9% |
| Range | 87.5% | 21.3% |
| Mean | 33.8% | 11.3% |
| Median | 28.1% | 10.7% |
| Interquartile 25% (IQ1) | 16.6% | 8.9% |
| Interquartile 75% (IQ3) | 33.3% | 13.0% |
| Interquartile Range (IQR) | 16.7% | 4.2% |
| Standard Deviation (Sample) | 26.5% | 5.1% |
| Standard Deviation (Population) | 25.4% | 5.0% |
Similar Demographics by Single Male Poverty
Demographics Similar to Alsatians by Single Male Poverty
In terms of single male poverty, the demographic groups most similar to Alsatians are Dominican (15.2%, a difference of 0.16%), Cree (15.1%, a difference of 0.98%), Aleut (15.4%, a difference of 1.0%), Alaska Native (15.4%, a difference of 1.1%), and Delaware (15.0%, a difference of 1.4%).
| Demographics | Rating | Rank | Single Male Poverty |
| Scotch-Irish | 0.0 /100 | #295 | Tragic 14.7% |
| Africans | 0.0 /100 | #296 | Tragic 14.7% |
| Immigrants | Dominican Republic | 0.0 /100 | #297 | Tragic 14.8% |
| French American Indians | 0.0 /100 | #298 | Tragic 15.0% |
| Delaware | 0.0 /100 | #299 | Tragic 15.0% |
| Cree | 0.0 /100 | #300 | Tragic 15.1% |
| Dominicans | 0.0 /100 | #301 | Tragic 15.2% |
| Alsatians | 0.0 /100 | #302 | Tragic 15.2% |
| Aleuts | 0.0 /100 | #303 | Tragic 15.4% |
| Alaska Natives | 0.0 /100 | #304 | Tragic 15.4% |
| Blackfeet | 0.0 /100 | #305 | Tragic 15.5% |
| Pennsylvania Germans | 0.0 /100 | #306 | Tragic 15.6% |
| Ute | 0.0 /100 | #307 | Tragic 15.7% |
| Potawatomi | 0.0 /100 | #308 | Tragic 15.8% |
| Americans | 0.0 /100 | #309 | Tragic 15.8% |
Demographics Similar to Immigrants from Lithuania by Single Male Poverty
In terms of single male poverty, the demographic groups most similar to Immigrants from Lithuania are Tlingit-Haida (11.6%, a difference of 0.060%), Immigrants from Indonesia (11.6%, a difference of 0.080%), Paraguayan (11.6%, a difference of 0.11%), Nepalese (11.6%, a difference of 0.15%), and Immigrants from Bulgaria (11.6%, a difference of 0.35%).
| Demographics | Rating | Rank | Single Male Poverty |
| Immigrants | Peru | 99.9 /100 | #43 | Exceptional 11.5% |
| Immigrants | Cameroon | 99.9 /100 | #44 | Exceptional 11.5% |
| Immigrants | Poland | 99.9 /100 | #45 | Exceptional 11.5% |
| Immigrants | Bulgaria | 99.9 /100 | #46 | Exceptional 11.6% |
| Nepalese | 99.9 /100 | #47 | Exceptional 11.6% |
| Immigrants | Indonesia | 99.9 /100 | #48 | Exceptional 11.6% |
| Tlingit-Haida | 99.9 /100 | #49 | Exceptional 11.6% |
| Immigrants | Lithuania | 99.9 /100 | #50 | Exceptional 11.6% |
| Paraguayans | 99.9 /100 | #51 | Exceptional 11.6% |
| Samoans | 99.9 /100 | #52 | Exceptional 11.7% |
| Bulgarians | 99.9 /100 | #53 | Exceptional 11.7% |
| Immigrants | Uzbekistan | 99.9 /100 | #54 | Exceptional 11.7% |
| Cypriots | 99.9 /100 | #55 | Exceptional 11.7% |
| Burmese | 99.8 /100 | #56 | Exceptional 11.7% |
| Immigrants | Romania | 99.8 /100 | #57 | Exceptional 11.7% |