Moroccan vs Immigrants from Lithuania Single Male Poverty
COMPARE
Moroccan
Immigrants from Lithuania
Single Male Poverty
Single Male Poverty Comparison
Moroccans
Immigrants from Lithuania
12.9%
SINGLE MALE POVERTY
36.8/ 100
METRIC RATING
182nd/ 347
METRIC RANK
11.6%
SINGLE MALE POVERTY
99.9/ 100
METRIC RATING
50th/ 347
METRIC RANK
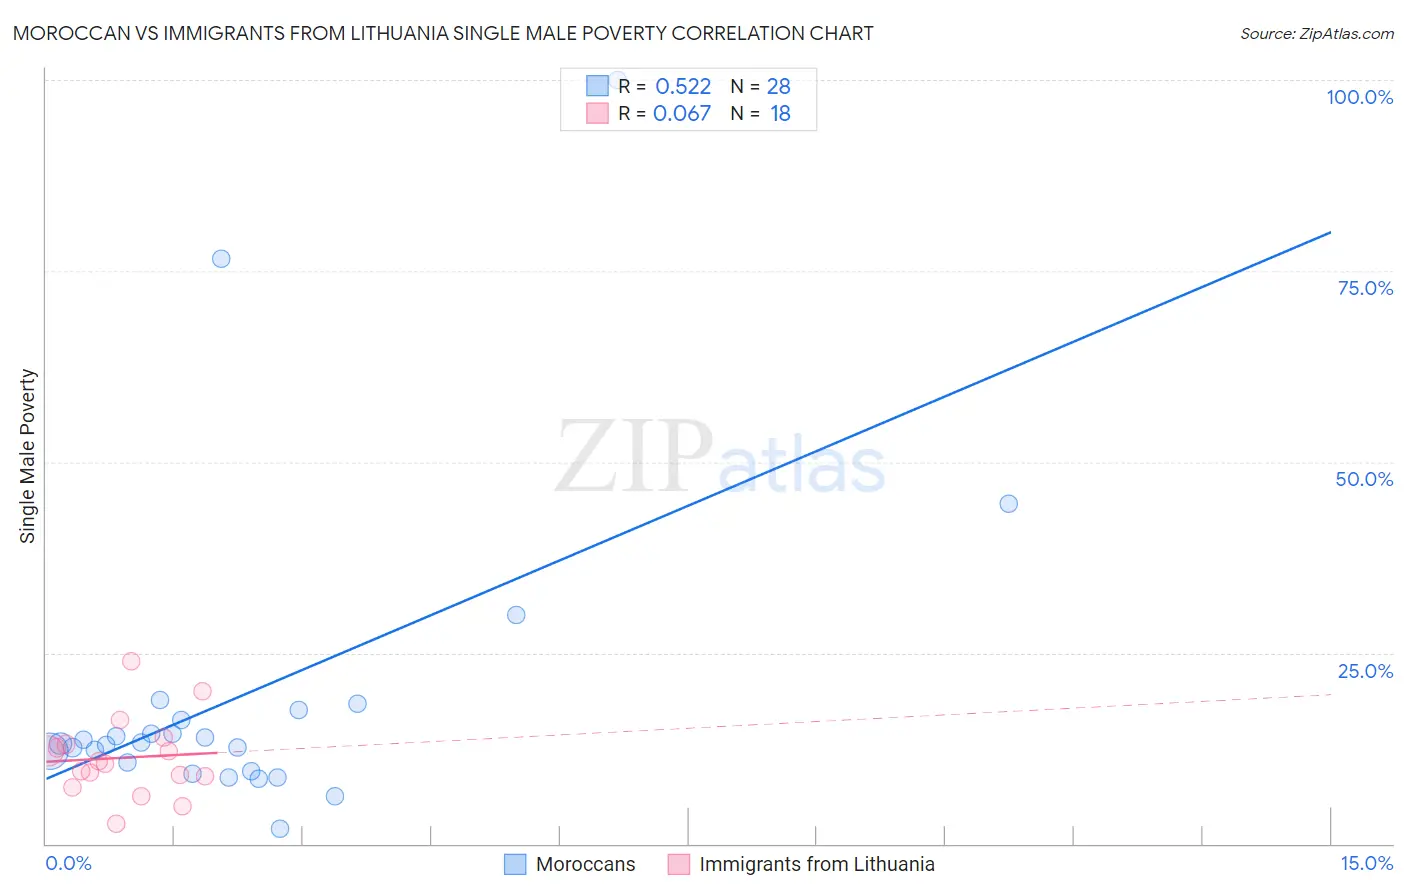
Moroccan vs Immigrants from Lithuania Single Male Poverty Correlation Chart
The statistical analysis conducted on geographies consisting of 188,123,639 people shows a substantial positive correlation between the proportion of Moroccans and poverty level among single males in the United States with a correlation coefficient (R) of 0.522 and weighted average of 12.9%. Similarly, the statistical analysis conducted on geographies consisting of 108,687,768 people shows a slight positive correlation between the proportion of Immigrants from Lithuania and poverty level among single males in the United States with a correlation coefficient (R) of 0.067 and weighted average of 11.6%, a difference of 11.1%.
Single Male Poverty Correlation Summary
| Measurement | Moroccan | Immigrants from Lithuania |
| Minimum | 1.9% | 2.6% |
| Maximum | 100.0% | 23.9% |
| Range | 98.1% | 21.3% |
| Mean | 19.4% | 11.3% |
| Median | 13.2% | 10.7% |
| Interquartile 25% (IQ1) | 10.0% | 8.9% |
| Interquartile 75% (IQ3) | 16.9% | 13.0% |
| Interquartile Range (IQR) | 6.9% | 4.2% |
| Standard Deviation (Sample) | 21.2% | 5.1% |
| Standard Deviation (Population) | 20.8% | 5.0% |
Similar Demographics by Single Male Poverty
Demographics Similar to Moroccans by Single Male Poverty
In terms of single male poverty, the demographic groups most similar to Moroccans are Panamanian (12.9%, a difference of 0.040%), Immigrants from North America (12.9%, a difference of 0.050%), Immigrants from West Indies (12.9%, a difference of 0.22%), Israeli (12.9%, a difference of 0.23%), and Immigrants from Trinidad and Tobago (12.9%, a difference of 0.25%).
| Demographics | Rating | Rank | Single Male Poverty |
| Croatians | 48.9 /100 | #175 | Average 12.8% |
| Syrians | 48.4 /100 | #176 | Average 12.8% |
| Immigrants | Canada | 44.8 /100 | #177 | Average 12.8% |
| Immigrants | Switzerland | 43.1 /100 | #178 | Average 12.8% |
| Israelis | 41.0 /100 | #179 | Average 12.9% |
| Immigrants | North America | 37.7 /100 | #180 | Fair 12.9% |
| Panamanians | 37.6 /100 | #181 | Fair 12.9% |
| Moroccans | 36.8 /100 | #182 | Fair 12.9% |
| Immigrants | West Indies | 33.0 /100 | #183 | Fair 12.9% |
| Immigrants | Trinidad and Tobago | 32.5 /100 | #184 | Fair 12.9% |
| Norwegians | 32.0 /100 | #185 | Fair 12.9% |
| Nigerians | 31.9 /100 | #186 | Fair 12.9% |
| Immigrants | Kuwait | 31.9 /100 | #187 | Fair 12.9% |
| Macedonians | 31.5 /100 | #188 | Fair 12.9% |
| Portuguese | 30.2 /100 | #189 | Fair 12.9% |
Demographics Similar to Immigrants from Lithuania by Single Male Poverty
In terms of single male poverty, the demographic groups most similar to Immigrants from Lithuania are Tlingit-Haida (11.6%, a difference of 0.060%), Immigrants from Indonesia (11.6%, a difference of 0.080%), Paraguayan (11.6%, a difference of 0.11%), Nepalese (11.6%, a difference of 0.15%), and Immigrants from Bulgaria (11.6%, a difference of 0.35%).
| Demographics | Rating | Rank | Single Male Poverty |
| Immigrants | Peru | 99.9 /100 | #43 | Exceptional 11.5% |
| Immigrants | Cameroon | 99.9 /100 | #44 | Exceptional 11.5% |
| Immigrants | Poland | 99.9 /100 | #45 | Exceptional 11.5% |
| Immigrants | Bulgaria | 99.9 /100 | #46 | Exceptional 11.6% |
| Nepalese | 99.9 /100 | #47 | Exceptional 11.6% |
| Immigrants | Indonesia | 99.9 /100 | #48 | Exceptional 11.6% |
| Tlingit-Haida | 99.9 /100 | #49 | Exceptional 11.6% |
| Immigrants | Lithuania | 99.9 /100 | #50 | Exceptional 11.6% |
| Paraguayans | 99.9 /100 | #51 | Exceptional 11.6% |
| Samoans | 99.9 /100 | #52 | Exceptional 11.7% |
| Bulgarians | 99.9 /100 | #53 | Exceptional 11.7% |
| Immigrants | Uzbekistan | 99.9 /100 | #54 | Exceptional 11.7% |
| Cypriots | 99.9 /100 | #55 | Exceptional 11.7% |
| Burmese | 99.8 /100 | #56 | Exceptional 11.7% |
| Immigrants | Romania | 99.8 /100 | #57 | Exceptional 11.7% |