Chinese vs Immigrants from Lithuania Single Male Poverty
COMPARE
Chinese
Immigrants from Lithuania
Single Male Poverty
Single Male Poverty Comparison
Chinese
Immigrants from Lithuania
11.0%
SINGLE MALE POVERTY
100.0/ 100
METRIC RATING
14th/ 347
METRIC RANK
11.6%
SINGLE MALE POVERTY
99.9/ 100
METRIC RATING
50th/ 347
METRIC RANK
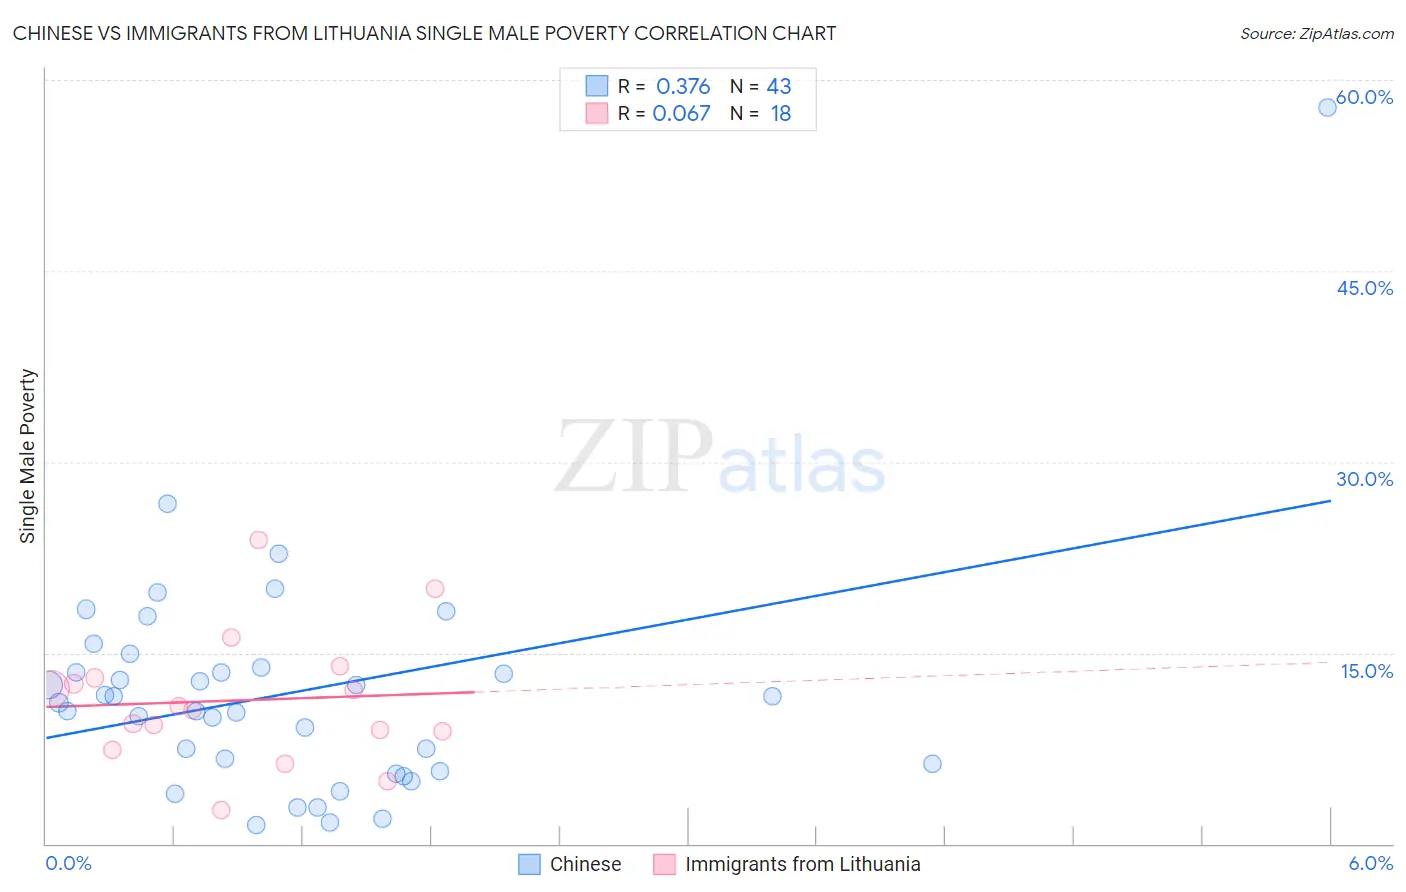
Chinese vs Immigrants from Lithuania Single Male Poverty Correlation Chart
The statistical analysis conducted on geographies consisting of 62,746,830 people shows a mild positive correlation between the proportion of Chinese and poverty level among single males in the United States with a correlation coefficient (R) of 0.376 and weighted average of 11.0%. Similarly, the statistical analysis conducted on geographies consisting of 108,687,768 people shows a slight positive correlation between the proportion of Immigrants from Lithuania and poverty level among single males in the United States with a correlation coefficient (R) of 0.067 and weighted average of 11.6%, a difference of 5.7%.
Single Male Poverty Correlation Summary
| Measurement | Chinese | Immigrants from Lithuania |
| Minimum | 1.5% | 2.6% |
| Maximum | 57.9% | 23.9% |
| Range | 56.4% | 21.3% |
| Mean | 11.9% | 11.3% |
| Median | 11.1% | 10.7% |
| Interquartile 25% (IQ1) | 5.7% | 8.9% |
| Interquartile 75% (IQ3) | 13.8% | 13.0% |
| Interquartile Range (IQR) | 8.1% | 4.2% |
| Standard Deviation (Sample) | 9.3% | 5.1% |
| Standard Deviation (Population) | 9.2% | 5.0% |
Similar Demographics by Single Male Poverty
Demographics Similar to Chinese by Single Male Poverty
In terms of single male poverty, the demographic groups most similar to Chinese are Korean (11.0%, a difference of 0.050%), Immigrants from South Central Asia (10.9%, a difference of 0.57%), Immigrants from Afghanistan (10.9%, a difference of 0.69%), Immigrants from Philippines (10.9%, a difference of 0.76%), and Immigrants from Fiji (10.9%, a difference of 0.78%).
| Demographics | Rating | Rank | Single Male Poverty |
| Afghans | 100.0 /100 | #7 | Exceptional 10.7% |
| Thais | 100.0 /100 | #8 | Exceptional 10.8% |
| Taiwanese | 100.0 /100 | #9 | Exceptional 10.9% |
| Immigrants | Fiji | 100.0 /100 | #10 | Exceptional 10.9% |
| Immigrants | Philippines | 100.0 /100 | #11 | Exceptional 10.9% |
| Immigrants | Afghanistan | 100.0 /100 | #12 | Exceptional 10.9% |
| Immigrants | South Central Asia | 100.0 /100 | #13 | Exceptional 10.9% |
| Chinese | 100.0 /100 | #14 | Exceptional 11.0% |
| Koreans | 100.0 /100 | #15 | Exceptional 11.0% |
| Bhutanese | 100.0 /100 | #16 | Exceptional 11.1% |
| Tsimshian | 100.0 /100 | #17 | Exceptional 11.1% |
| Immigrants | Bolivia | 100.0 /100 | #18 | Exceptional 11.1% |
| Immigrants | Moldova | 100.0 /100 | #19 | Exceptional 11.2% |
| Ethiopians | 100.0 /100 | #20 | Exceptional 11.2% |
| Asians | 100.0 /100 | #21 | Exceptional 11.2% |
Demographics Similar to Immigrants from Lithuania by Single Male Poverty
In terms of single male poverty, the demographic groups most similar to Immigrants from Lithuania are Tlingit-Haida (11.6%, a difference of 0.060%), Immigrants from Indonesia (11.6%, a difference of 0.080%), Paraguayan (11.6%, a difference of 0.11%), Nepalese (11.6%, a difference of 0.15%), and Immigrants from Bulgaria (11.6%, a difference of 0.35%).
| Demographics | Rating | Rank | Single Male Poverty |
| Immigrants | Peru | 99.9 /100 | #43 | Exceptional 11.5% |
| Immigrants | Cameroon | 99.9 /100 | #44 | Exceptional 11.5% |
| Immigrants | Poland | 99.9 /100 | #45 | Exceptional 11.5% |
| Immigrants | Bulgaria | 99.9 /100 | #46 | Exceptional 11.6% |
| Nepalese | 99.9 /100 | #47 | Exceptional 11.6% |
| Immigrants | Indonesia | 99.9 /100 | #48 | Exceptional 11.6% |
| Tlingit-Haida | 99.9 /100 | #49 | Exceptional 11.6% |
| Immigrants | Lithuania | 99.9 /100 | #50 | Exceptional 11.6% |
| Paraguayans | 99.9 /100 | #51 | Exceptional 11.6% |
| Samoans | 99.9 /100 | #52 | Exceptional 11.7% |
| Bulgarians | 99.9 /100 | #53 | Exceptional 11.7% |
| Immigrants | Uzbekistan | 99.9 /100 | #54 | Exceptional 11.7% |
| Cypriots | 99.9 /100 | #55 | Exceptional 11.7% |
| Burmese | 99.8 /100 | #56 | Exceptional 11.7% |
| Immigrants | Romania | 99.8 /100 | #57 | Exceptional 11.7% |