Italian vs Immigrants from Lithuania Single Male Poverty
COMPARE
Italian
Immigrants from Lithuania
Single Male Poverty
Single Male Poverty Comparison
Italians
Immigrants from Lithuania
13.1%
SINGLE MALE POVERTY
15.9/ 100
METRIC RATING
213th/ 347
METRIC RANK
11.6%
SINGLE MALE POVERTY
99.9/ 100
METRIC RATING
50th/ 347
METRIC RANK
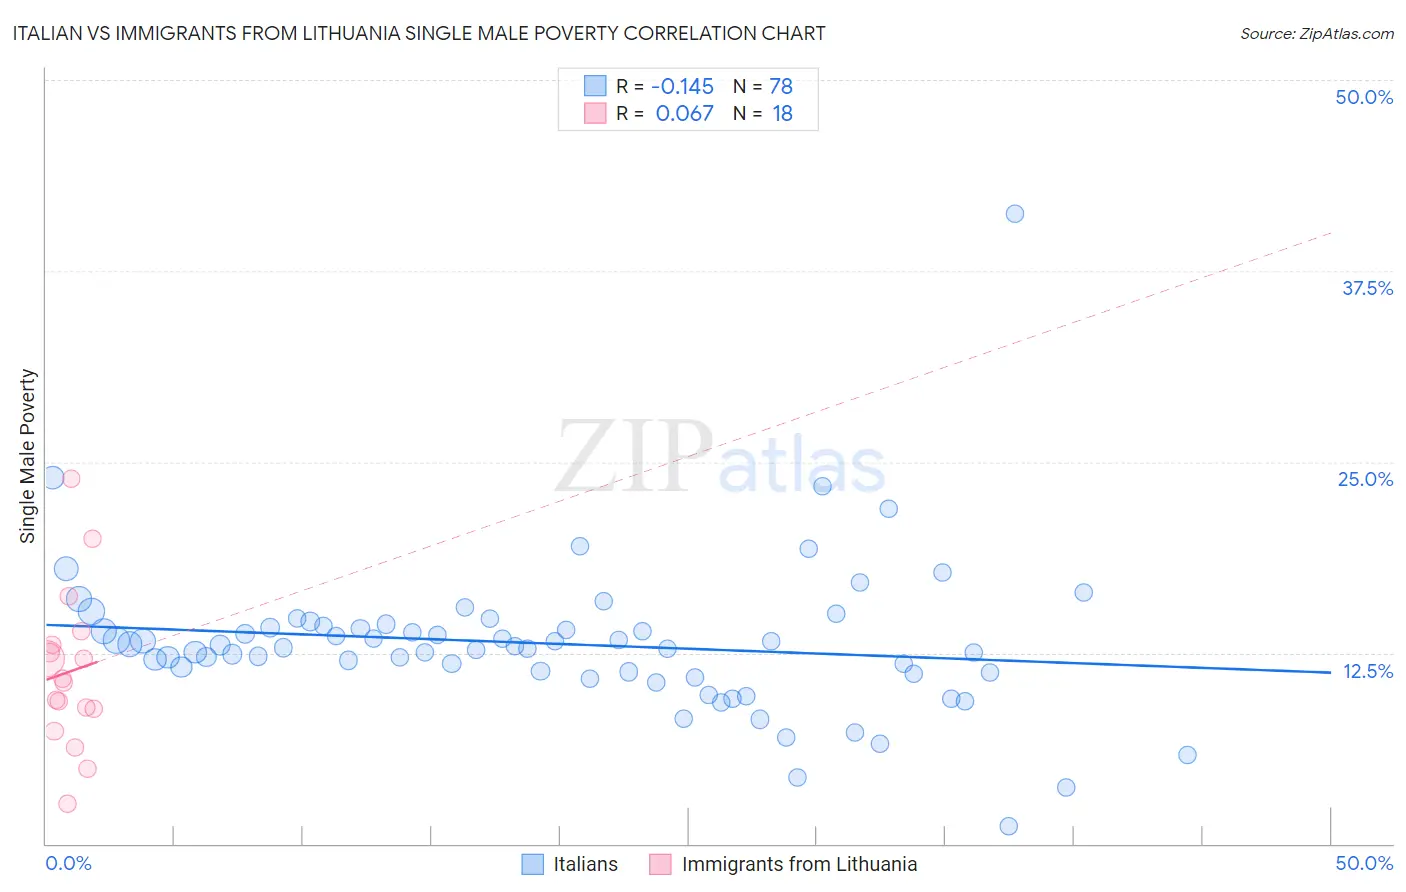
Italian vs Immigrants from Lithuania Single Male Poverty Correlation Chart
The statistical analysis conducted on geographies consisting of 474,306,770 people shows a poor negative correlation between the proportion of Italians and poverty level among single males in the United States with a correlation coefficient (R) of -0.145 and weighted average of 13.1%. Similarly, the statistical analysis conducted on geographies consisting of 108,687,768 people shows a slight positive correlation between the proportion of Immigrants from Lithuania and poverty level among single males in the United States with a correlation coefficient (R) of 0.067 and weighted average of 11.6%, a difference of 12.7%.
Single Male Poverty Correlation Summary
| Measurement | Italian | Immigrants from Lithuania |
| Minimum | 1.1% | 2.6% |
| Maximum | 41.2% | 23.9% |
| Range | 40.1% | 21.3% |
| Mean | 13.1% | 11.3% |
| Median | 12.9% | 10.7% |
| Interquartile 25% (IQ1) | 11.2% | 8.9% |
| Interquartile 75% (IQ3) | 14.3% | 13.0% |
| Interquartile Range (IQR) | 3.1% | 4.2% |
| Standard Deviation (Sample) | 5.0% | 5.1% |
| Standard Deviation (Population) | 5.0% | 5.0% |
Similar Demographics by Single Male Poverty
Demographics Similar to Italians by Single Male Poverty
In terms of single male poverty, the demographic groups most similar to Italians are Senegalese (13.1%, a difference of 0.050%), Swedish (13.1%, a difference of 0.080%), Immigrants from Haiti (13.1%, a difference of 0.090%), Zimbabwean (13.1%, a difference of 0.090%), and Japanese (13.1%, a difference of 0.11%).
| Demographics | Rating | Rank | Single Male Poverty |
| Northern Europeans | 18.9 /100 | #206 | Poor 13.0% |
| Sudanese | 17.7 /100 | #207 | Poor 13.1% |
| Immigrants | Western Africa | 17.6 /100 | #208 | Poor 13.1% |
| Mexican American Indians | 17.5 /100 | #209 | Poor 13.1% |
| Immigrants | Haiti | 16.8 /100 | #210 | Poor 13.1% |
| Swedes | 16.8 /100 | #211 | Poor 13.1% |
| Senegalese | 16.4 /100 | #212 | Poor 13.1% |
| Italians | 15.9 /100 | #213 | Poor 13.1% |
| Zimbabweans | 14.9 /100 | #214 | Poor 13.1% |
| Japanese | 14.8 /100 | #215 | Poor 13.1% |
| Austrians | 13.9 /100 | #216 | Poor 13.1% |
| Bermudans | 13.0 /100 | #217 | Poor 13.1% |
| Scandinavians | 12.9 /100 | #218 | Poor 13.1% |
| Immigrants | Burma/Myanmar | 12.6 /100 | #219 | Poor 13.1% |
| Central Americans | 10.9 /100 | #220 | Poor 13.2% |
Demographics Similar to Immigrants from Lithuania by Single Male Poverty
In terms of single male poverty, the demographic groups most similar to Immigrants from Lithuania are Tlingit-Haida (11.6%, a difference of 0.060%), Immigrants from Indonesia (11.6%, a difference of 0.080%), Paraguayan (11.6%, a difference of 0.11%), Nepalese (11.6%, a difference of 0.15%), and Immigrants from Bulgaria (11.6%, a difference of 0.35%).
| Demographics | Rating | Rank | Single Male Poverty |
| Immigrants | Peru | 99.9 /100 | #43 | Exceptional 11.5% |
| Immigrants | Cameroon | 99.9 /100 | #44 | Exceptional 11.5% |
| Immigrants | Poland | 99.9 /100 | #45 | Exceptional 11.5% |
| Immigrants | Bulgaria | 99.9 /100 | #46 | Exceptional 11.6% |
| Nepalese | 99.9 /100 | #47 | Exceptional 11.6% |
| Immigrants | Indonesia | 99.9 /100 | #48 | Exceptional 11.6% |
| Tlingit-Haida | 99.9 /100 | #49 | Exceptional 11.6% |
| Immigrants | Lithuania | 99.9 /100 | #50 | Exceptional 11.6% |
| Paraguayans | 99.9 /100 | #51 | Exceptional 11.6% |
| Samoans | 99.9 /100 | #52 | Exceptional 11.7% |
| Bulgarians | 99.9 /100 | #53 | Exceptional 11.7% |
| Immigrants | Uzbekistan | 99.9 /100 | #54 | Exceptional 11.7% |
| Cypriots | 99.9 /100 | #55 | Exceptional 11.7% |
| Burmese | 99.8 /100 | #56 | Exceptional 11.7% |
| Immigrants | Romania | 99.8 /100 | #57 | Exceptional 11.7% |