Immigrants from St. Vincent and the Grenadines vs Immigrants from Hong Kong Single Male Poverty
COMPARE
Immigrants from St. Vincent and the Grenadines
Immigrants from Hong Kong
Single Male Poverty
Single Male Poverty Comparison
Immigrants from St. Vincent and the Grenadines
Immigrants from Hong Kong
12.8%
SINGLE MALE POVERTY
50.9/ 100
METRIC RATING
173rd/ 347
METRIC RANK
10.4%
SINGLE MALE POVERTY
100.0/ 100
METRIC RATING
4th/ 347
METRIC RANK
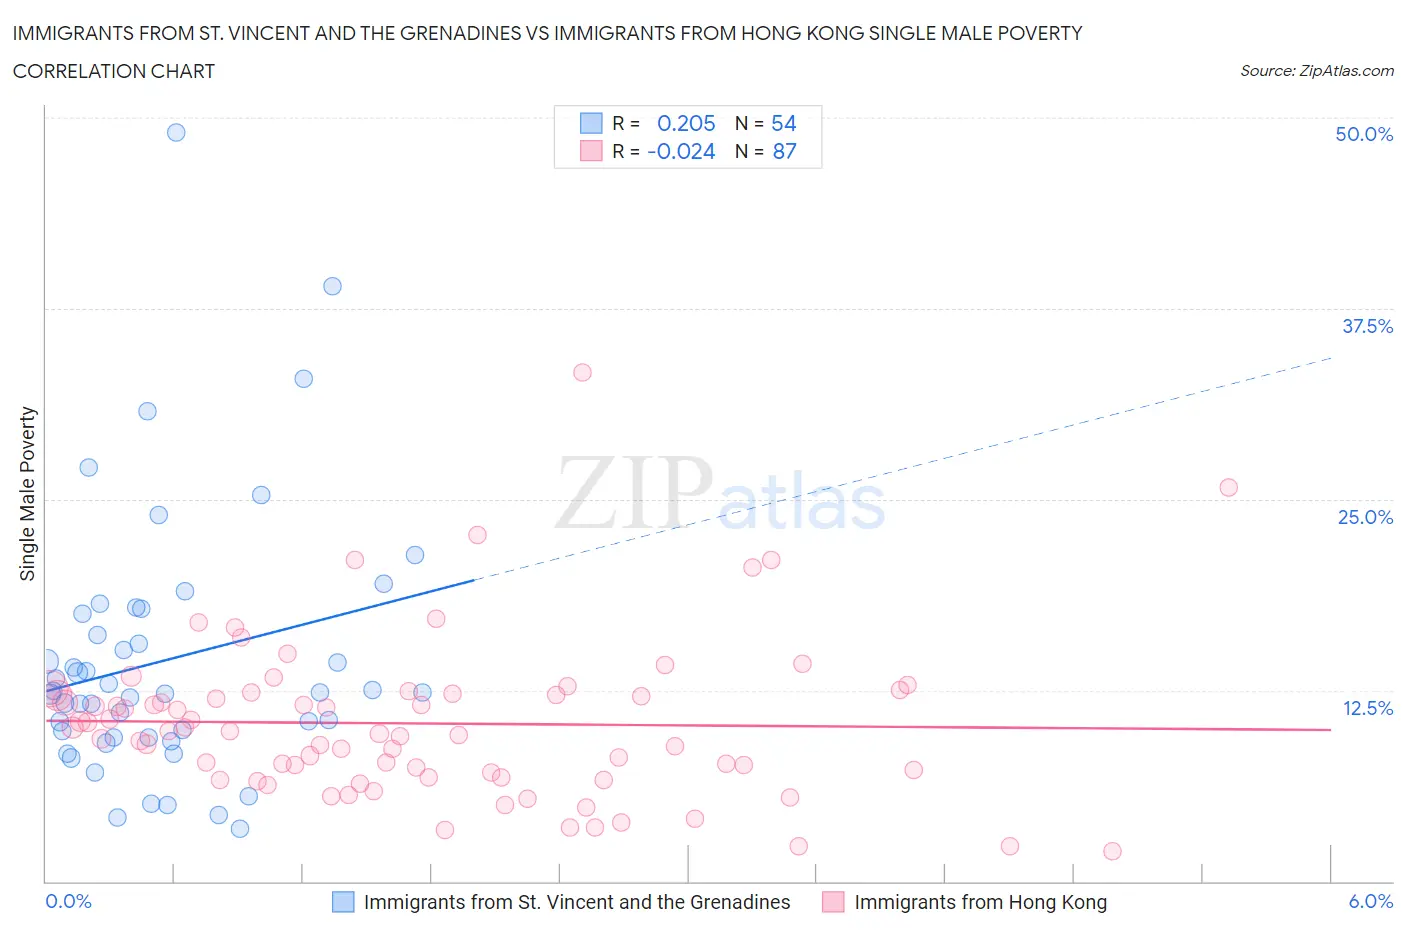
Immigrants from St. Vincent and the Grenadines vs Immigrants from Hong Kong Single Male Poverty Correlation Chart
The statistical analysis conducted on geographies consisting of 54,238,308 people shows a weak positive correlation between the proportion of Immigrants from St. Vincent and the Grenadines and poverty level among single males in the United States with a correlation coefficient (R) of 0.205 and weighted average of 12.8%. Similarly, the statistical analysis conducted on geographies consisting of 230,546,344 people shows no correlation between the proportion of Immigrants from Hong Kong and poverty level among single males in the United States with a correlation coefficient (R) of -0.024 and weighted average of 10.4%, a difference of 22.5%.
Single Male Poverty Correlation Summary
| Measurement | Immigrants from St. Vincent and the Grenadines | Immigrants from Hong Kong |
| Minimum | 3.5% | 1.9% |
| Maximum | 49.0% | 33.3% |
| Range | 45.5% | 31.4% |
| Mean | 14.5% | 10.3% |
| Median | 12.4% | 9.8% |
| Interquartile 25% (IQ1) | 9.4% | 6.8% |
| Interquartile 75% (IQ3) | 17.5% | 12.3% |
| Interquartile Range (IQR) | 8.1% | 5.4% |
| Standard Deviation (Sample) | 8.6% | 5.2% |
| Standard Deviation (Population) | 8.5% | 5.2% |
Similar Demographics by Single Male Poverty
Demographics Similar to Immigrants from St. Vincent and the Grenadines by Single Male Poverty
In terms of single male poverty, the demographic groups most similar to Immigrants from St. Vincent and the Grenadines are South African (12.8%, a difference of 0.030%), Danish (12.8%, a difference of 0.030%), Costa Rican (12.8%, a difference of 0.050%), Guyanese (12.8%, a difference of 0.060%), and Croatian (12.8%, a difference of 0.11%).
| Demographics | Rating | Rank | Single Male Poverty |
| Immigrants | Guyana | 60.5 /100 | #166 | Good 12.7% |
| Immigrants | Sudan | 58.2 /100 | #167 | Average 12.7% |
| Immigrants | Barbados | 57.7 /100 | #168 | Average 12.7% |
| Puget Sound Salish | 54.3 /100 | #169 | Average 12.8% |
| Guyanese | 52.0 /100 | #170 | Average 12.8% |
| South Africans | 51.5 /100 | #171 | Average 12.8% |
| Danes | 51.4 /100 | #172 | Average 12.8% |
| Immigrants | St. Vincent and the Grenadines | 50.9 /100 | #173 | Average 12.8% |
| Costa Ricans | 50.0 /100 | #174 | Average 12.8% |
| Croatians | 48.9 /100 | #175 | Average 12.8% |
| Syrians | 48.4 /100 | #176 | Average 12.8% |
| Immigrants | Canada | 44.8 /100 | #177 | Average 12.8% |
| Immigrants | Switzerland | 43.1 /100 | #178 | Average 12.8% |
| Israelis | 41.0 /100 | #179 | Average 12.9% |
| Immigrants | North America | 37.7 /100 | #180 | Fair 12.9% |
Demographics Similar to Immigrants from Hong Kong by Single Male Poverty
In terms of single male poverty, the demographic groups most similar to Immigrants from Hong Kong are Tongan (10.5%, a difference of 0.060%), Immigrants from India (10.3%, a difference of 0.97%), Immigrants from Taiwan (10.3%, a difference of 1.7%), Filipino (10.6%, a difference of 1.7%), and Afghan (10.7%, a difference of 2.5%).
| Demographics | Rating | Rank | Single Male Poverty |
| Assyrians/Chaldeans/Syriacs | 100.0 /100 | #1 | Exceptional 9.8% |
| Immigrants | Taiwan | 100.0 /100 | #2 | Exceptional 10.3% |
| Immigrants | India | 100.0 /100 | #3 | Exceptional 10.3% |
| Immigrants | Hong Kong | 100.0 /100 | #4 | Exceptional 10.4% |
| Tongans | 100.0 /100 | #5 | Exceptional 10.5% |
| Filipinos | 100.0 /100 | #6 | Exceptional 10.6% |
| Afghans | 100.0 /100 | #7 | Exceptional 10.7% |
| Thais | 100.0 /100 | #8 | Exceptional 10.8% |
| Taiwanese | 100.0 /100 | #9 | Exceptional 10.9% |
| Immigrants | Fiji | 100.0 /100 | #10 | Exceptional 10.9% |
| Immigrants | Philippines | 100.0 /100 | #11 | Exceptional 10.9% |
| Immigrants | Afghanistan | 100.0 /100 | #12 | Exceptional 10.9% |
| Immigrants | South Central Asia | 100.0 /100 | #13 | Exceptional 10.9% |
| Chinese | 100.0 /100 | #14 | Exceptional 11.0% |
| Koreans | 100.0 /100 | #15 | Exceptional 11.0% |