English vs Immigrants from Hong Kong Single Male Poverty
COMPARE
English
Immigrants from Hong Kong
Single Male Poverty
Single Male Poverty Comparison
English
Immigrants from Hong Kong
14.1%
SINGLE MALE POVERTY
0.1/ 100
METRIC RATING
275th/ 347
METRIC RANK
10.4%
SINGLE MALE POVERTY
100.0/ 100
METRIC RATING
4th/ 347
METRIC RANK
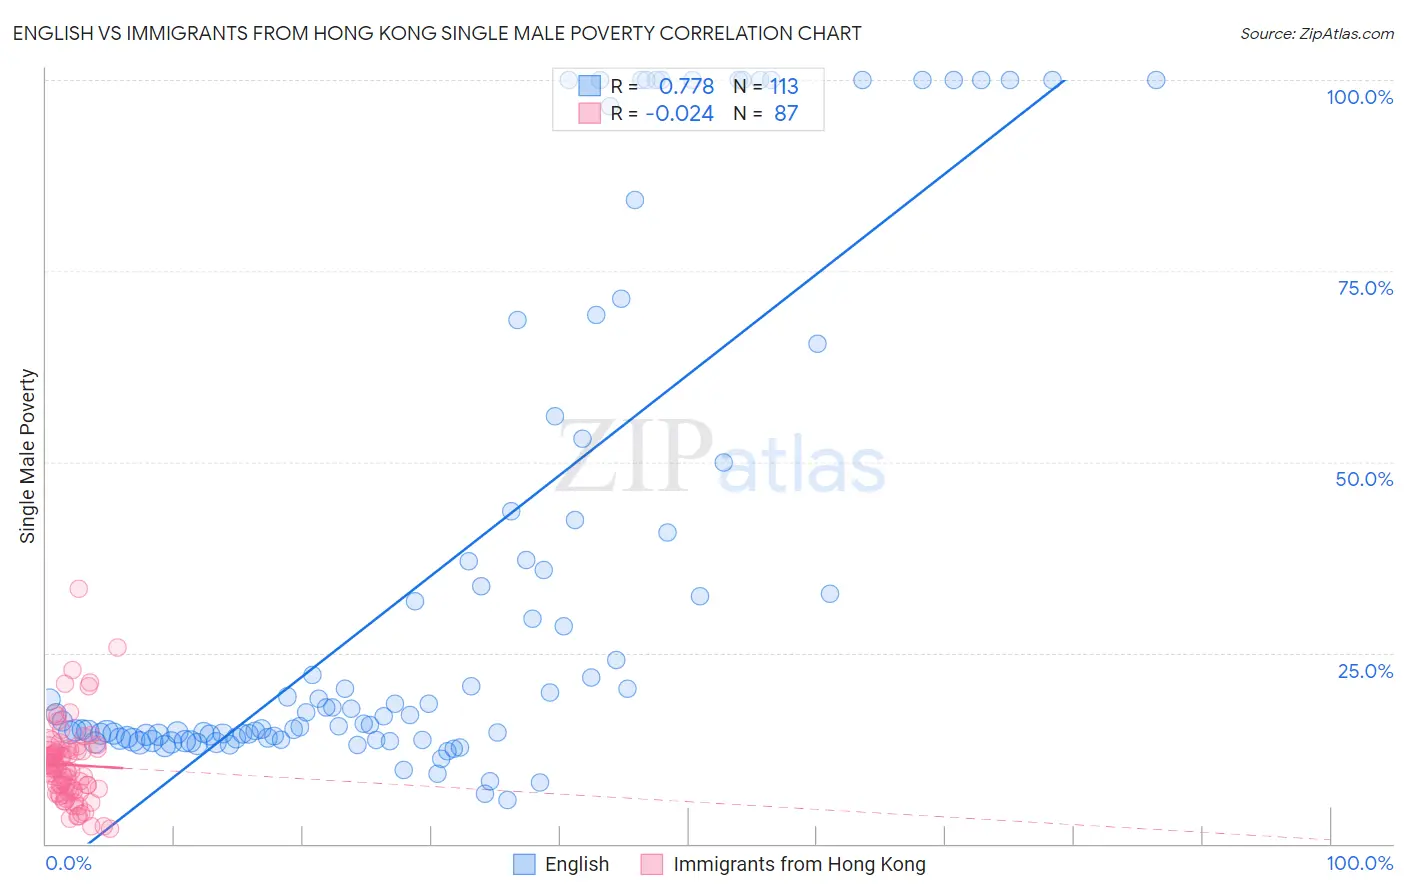
English vs Immigrants from Hong Kong Single Male Poverty Correlation Chart
The statistical analysis conducted on geographies consisting of 475,099,877 people shows a strong positive correlation between the proportion of English and poverty level among single males in the United States with a correlation coefficient (R) of 0.778 and weighted average of 14.1%. Similarly, the statistical analysis conducted on geographies consisting of 230,546,344 people shows no correlation between the proportion of Immigrants from Hong Kong and poverty level among single males in the United States with a correlation coefficient (R) of -0.024 and weighted average of 10.4%, a difference of 34.6%.
Single Male Poverty Correlation Summary
| Measurement | English | Immigrants from Hong Kong |
| Minimum | 5.8% | 1.9% |
| Maximum | 100.0% | 33.3% |
| Range | 94.2% | 31.4% |
| Mean | 34.8% | 10.3% |
| Median | 16.8% | 9.8% |
| Interquartile 25% (IQ1) | 13.9% | 6.8% |
| Interquartile 75% (IQ3) | 43.0% | 12.3% |
| Interquartile Range (IQR) | 29.1% | 5.4% |
| Standard Deviation (Sample) | 32.6% | 5.2% |
| Standard Deviation (Population) | 32.5% | 5.2% |
Similar Demographics by Single Male Poverty
Demographics Similar to English by Single Male Poverty
In terms of single male poverty, the demographic groups most similar to English are Honduran (14.0%, a difference of 0.080%), Dutch (14.1%, a difference of 0.12%), Immigrants from Honduras (14.1%, a difference of 0.16%), Welsh (14.0%, a difference of 0.21%), and Slovak (14.1%, a difference of 0.22%).
| Demographics | Rating | Rank | Single Male Poverty |
| Immigrants | Mexico | 0.1 /100 | #268 | Tragic 13.9% |
| Scottish | 0.1 /100 | #269 | Tragic 14.0% |
| Immigrants | Saudi Arabia | 0.1 /100 | #270 | Tragic 14.0% |
| Irish | 0.1 /100 | #271 | Tragic 14.0% |
| Mexicans | 0.1 /100 | #272 | Tragic 14.0% |
| Welsh | 0.1 /100 | #273 | Tragic 14.0% |
| Hondurans | 0.1 /100 | #274 | Tragic 14.0% |
| English | 0.1 /100 | #275 | Tragic 14.1% |
| Dutch | 0.1 /100 | #276 | Tragic 14.1% |
| Immigrants | Honduras | 0.0 /100 | #277 | Tragic 14.1% |
| Slovaks | 0.0 /100 | #278 | Tragic 14.1% |
| Indonesians | 0.0 /100 | #279 | Tragic 14.1% |
| Hmong | 0.0 /100 | #280 | Tragic 14.2% |
| Hispanics or Latinos | 0.0 /100 | #281 | Tragic 14.2% |
| Spanish Americans | 0.0 /100 | #282 | Tragic 14.2% |
Demographics Similar to Immigrants from Hong Kong by Single Male Poverty
In terms of single male poverty, the demographic groups most similar to Immigrants from Hong Kong are Tongan (10.5%, a difference of 0.060%), Immigrants from India (10.3%, a difference of 0.97%), Immigrants from Taiwan (10.3%, a difference of 1.7%), Filipino (10.6%, a difference of 1.7%), and Afghan (10.7%, a difference of 2.5%).
| Demographics | Rating | Rank | Single Male Poverty |
| Assyrians/Chaldeans/Syriacs | 100.0 /100 | #1 | Exceptional 9.8% |
| Immigrants | Taiwan | 100.0 /100 | #2 | Exceptional 10.3% |
| Immigrants | India | 100.0 /100 | #3 | Exceptional 10.3% |
| Immigrants | Hong Kong | 100.0 /100 | #4 | Exceptional 10.4% |
| Tongans | 100.0 /100 | #5 | Exceptional 10.5% |
| Filipinos | 100.0 /100 | #6 | Exceptional 10.6% |
| Afghans | 100.0 /100 | #7 | Exceptional 10.7% |
| Thais | 100.0 /100 | #8 | Exceptional 10.8% |
| Taiwanese | 100.0 /100 | #9 | Exceptional 10.9% |
| Immigrants | Fiji | 100.0 /100 | #10 | Exceptional 10.9% |
| Immigrants | Philippines | 100.0 /100 | #11 | Exceptional 10.9% |
| Immigrants | Afghanistan | 100.0 /100 | #12 | Exceptional 10.9% |
| Immigrants | South Central Asia | 100.0 /100 | #13 | Exceptional 10.9% |
| Chinese | 100.0 /100 | #14 | Exceptional 11.0% |
| Koreans | 100.0 /100 | #15 | Exceptional 11.0% |