Houma vs Panamanian Poverty
COMPARE
Houma
Panamanian
Poverty
Poverty Comparison
Houma
Panamanians
18.4%
POVERTY
0.0/ 100
METRIC RATING
333rd/ 347
METRIC RANK
13.1%
POVERTY
6.6/ 100
METRIC RATING
207th/ 347
METRIC RANK
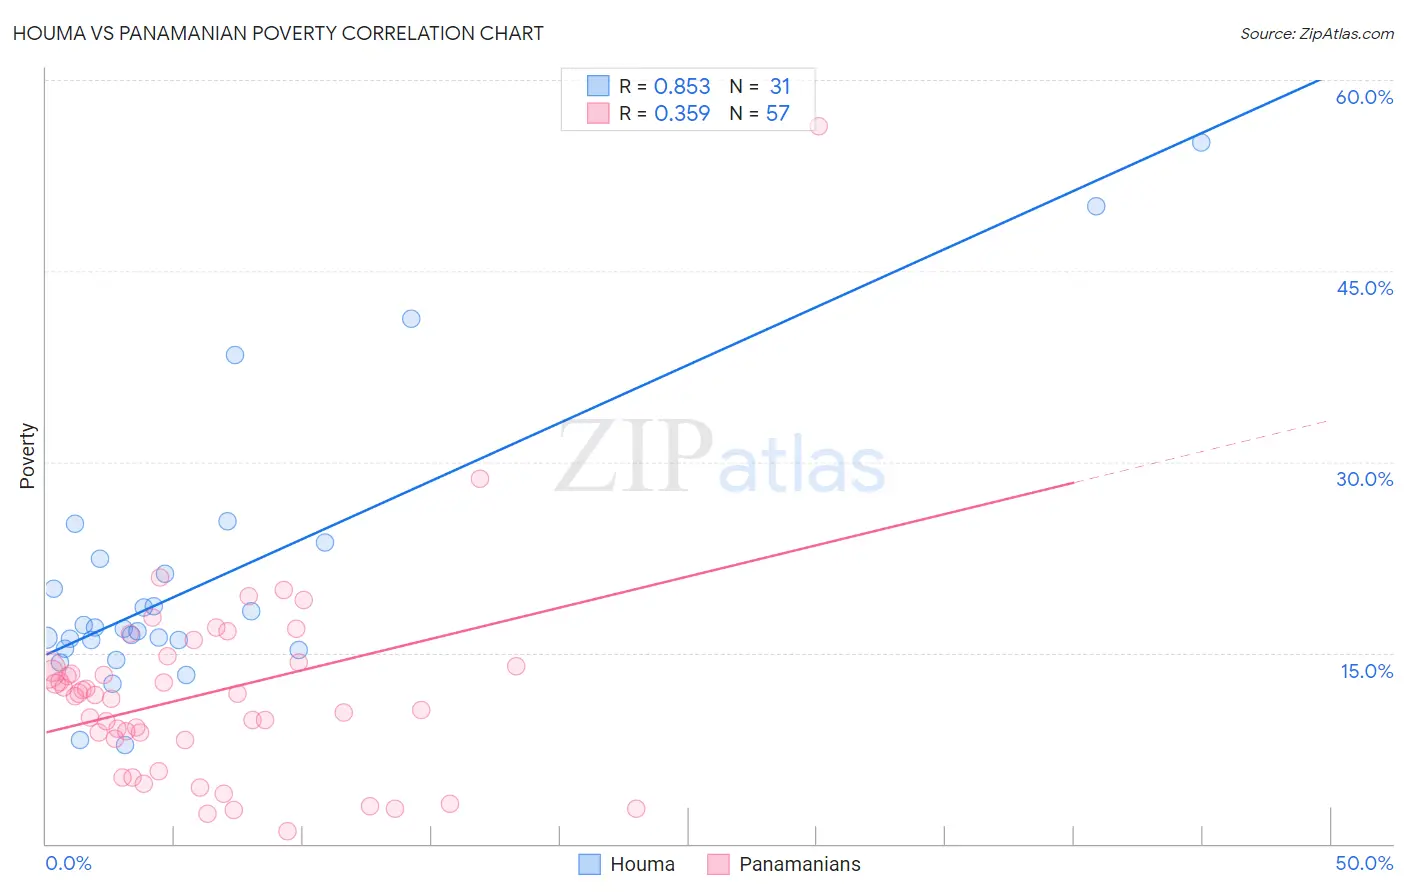
Houma vs Panamanian Poverty Correlation Chart
The statistical analysis conducted on geographies consisting of 36,796,778 people shows a very strong positive correlation between the proportion of Houma and poverty level in the United States with a correlation coefficient (R) of 0.853 and weighted average of 18.4%. Similarly, the statistical analysis conducted on geographies consisting of 281,075,399 people shows a mild positive correlation between the proportion of Panamanians and poverty level in the United States with a correlation coefficient (R) of 0.359 and weighted average of 13.1%, a difference of 40.5%.
Poverty Correlation Summary
| Measurement | Houma | Panamanian |
| Minimum | 7.7% | 0.99% |
| Maximum | 55.1% | 56.4% |
| Range | 47.4% | 55.4% |
| Mean | 20.8% | 11.9% |
| Median | 16.9% | 11.7% |
| Interquartile 25% (IQ1) | 15.3% | 8.2% |
| Interquartile 75% (IQ3) | 22.4% | 14.1% |
| Interquartile Range (IQR) | 7.1% | 5.9% |
| Standard Deviation (Sample) | 11.0% | 8.1% |
| Standard Deviation (Population) | 10.8% | 8.1% |
Similar Demographics by Poverty
Demographics Similar to Houma by Poverty
In terms of poverty, the demographic groups most similar to Houma are Apache (18.4%, a difference of 0.0%), Native/Alaskan (18.1%, a difference of 2.0%), Cheyenne (18.9%, a difference of 2.8%), Immigrants from Dominican Republic (17.8%, a difference of 3.5%), and Dominican (17.6%, a difference of 4.4%).
| Demographics | Rating | Rank | Poverty |
| Paiute | 0.0 /100 | #326 | Tragic 16.7% |
| Kiowa | 0.0 /100 | #327 | Tragic 16.8% |
| Ute | 0.0 /100 | #328 | Tragic 16.9% |
| Blacks/African Americans | 0.0 /100 | #329 | Tragic 17.3% |
| Dominicans | 0.0 /100 | #330 | Tragic 17.6% |
| Immigrants | Dominican Republic | 0.0 /100 | #331 | Tragic 17.8% |
| Natives/Alaskans | 0.0 /100 | #332 | Tragic 18.1% |
| Houma | 0.0 /100 | #333 | Tragic 18.4% |
| Apache | 0.0 /100 | #334 | Tragic 18.4% |
| Cheyenne | 0.0 /100 | #335 | Tragic 18.9% |
| Pueblo | 0.0 /100 | #336 | Tragic 19.4% |
| Sioux | 0.0 /100 | #337 | Tragic 19.8% |
| Yuman | 0.0 /100 | #338 | Tragic 20.2% |
| Crow | 0.0 /100 | #339 | Tragic 20.7% |
| Yup'ik | 0.0 /100 | #340 | Tragic 20.8% |
Demographics Similar to Panamanians by Poverty
In terms of poverty, the demographic groups most similar to Panamanians are Immigrants from Eastern Africa (13.1%, a difference of 0.12%), Ugandan (13.1%, a difference of 0.15%), Malaysian (13.1%, a difference of 0.18%), Immigrants from the Azores (13.1%, a difference of 0.21%), and Moroccan (13.2%, a difference of 0.57%).
| Demographics | Rating | Rank | Poverty |
| Spaniards | 16.5 /100 | #200 | Poor 12.8% |
| Immigrants | Uganda | 16.5 /100 | #201 | Poor 12.8% |
| Immigrants | Uruguay | 15.6 /100 | #202 | Poor 12.8% |
| Hmong | 15.0 /100 | #203 | Poor 12.8% |
| Immigrants | Western Asia | 14.1 /100 | #204 | Poor 12.9% |
| Tsimshian | 9.2 /100 | #205 | Tragic 13.0% |
| Immigrants | Eastern Africa | 7.0 /100 | #206 | Tragic 13.1% |
| Panamanians | 6.6 /100 | #207 | Tragic 13.1% |
| Ugandans | 6.2 /100 | #208 | Tragic 13.1% |
| Malaysians | 6.1 /100 | #209 | Tragic 13.1% |
| Immigrants | Azores | 6.1 /100 | #210 | Tragic 13.1% |
| Moroccans | 5.2 /100 | #211 | Tragic 13.2% |
| Immigrants | Immigrants | 4.3 /100 | #212 | Tragic 13.2% |
| Immigrants | Panama | 4.1 /100 | #213 | Tragic 13.3% |
| Bermudans | 3.7 /100 | #214 | Tragic 13.3% |