Houma vs Immigrants from Fiji Median Family Income
COMPARE
Houma
Immigrants from Fiji
Median Family Income
Median Family Income Comparison
Houma
Immigrants from Fiji
$76,188
MEDIAN FAMILY INCOME
0.0/ 100
METRIC RATING
343rd/ 347
METRIC RANK
$106,544
MEDIAN FAMILY INCOME
87.8/ 100
METRIC RATING
132nd/ 347
METRIC RANK
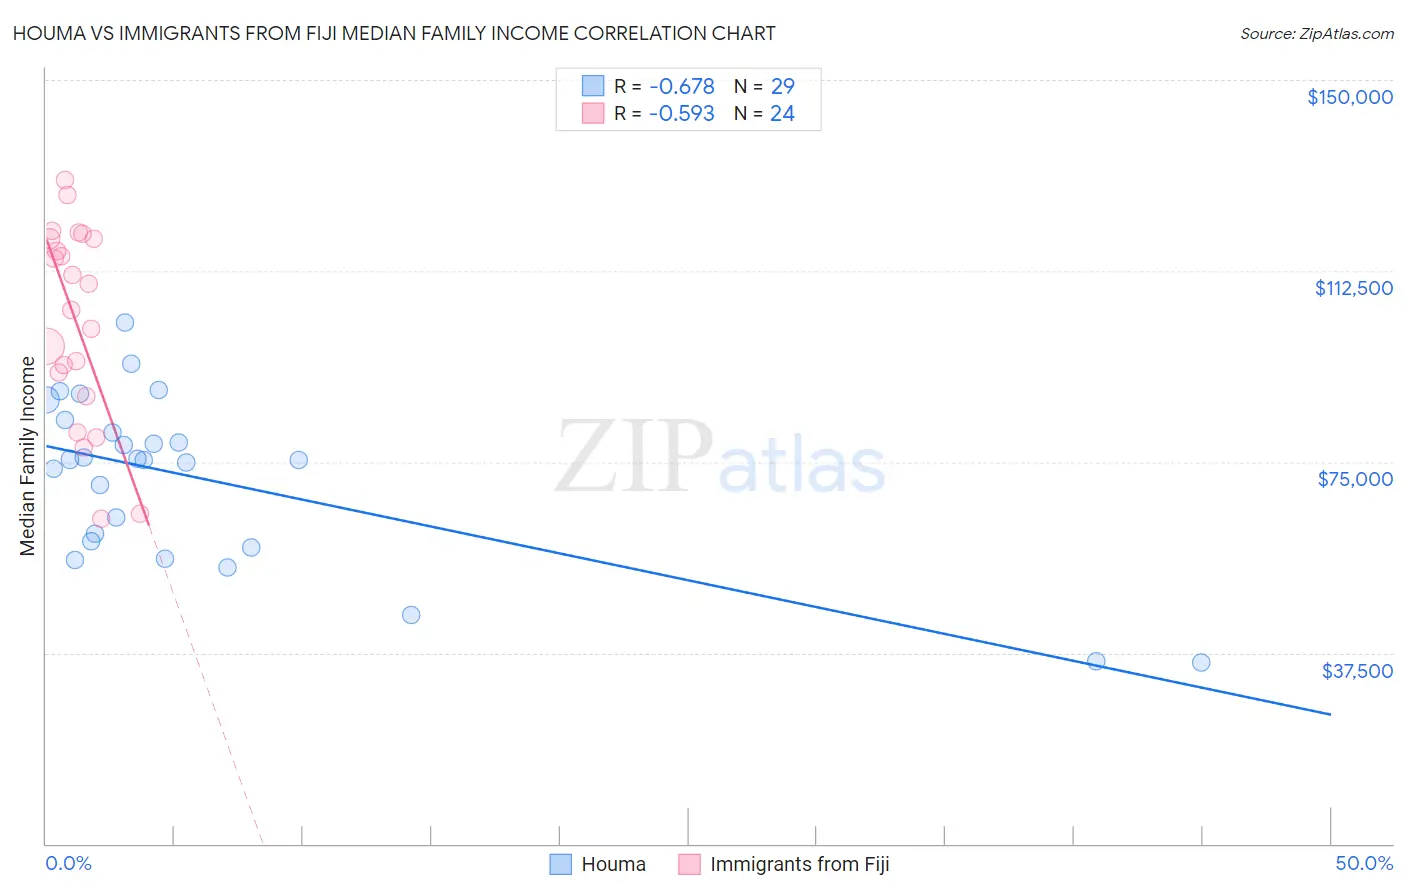
Houma vs Immigrants from Fiji Median Family Income Correlation Chart
The statistical analysis conducted on geographies consisting of 36,790,797 people shows a significant negative correlation between the proportion of Houma and median family income in the United States with a correlation coefficient (R) of -0.678 and weighted average of $76,188. Similarly, the statistical analysis conducted on geographies consisting of 93,753,108 people shows a substantial negative correlation between the proportion of Immigrants from Fiji and median family income in the United States with a correlation coefficient (R) of -0.593 and weighted average of $106,544, a difference of 39.8%.
Median Family Income Correlation Summary
| Measurement | Houma | Immigrants from Fiji |
| Minimum | $35,539 | $63,924 |
| Maximum | $102,344 | $130,465 |
| Range | $66,805 | $66,540 |
| Mean | $71,438 | $102,660 |
| Median | $75,379 | $107,335 |
| Interquartile 25% (IQ1) | $58,820 | $90,188 |
| Interquartile 75% (IQ3) | $82,023 | $118,761 |
| Interquartile Range (IQR) | $23,203 | $28,573 |
| Standard Deviation (Sample) | $16,513 | $19,212 |
| Standard Deviation (Population) | $16,226 | $18,807 |
Similar Demographics by Median Family Income
Demographics Similar to Houma by Median Family Income
In terms of median family income, the demographic groups most similar to Houma are Crow ($76,605, a difference of 0.55%), Pueblo ($76,880, a difference of 0.91%), Hopi ($77,188, a difference of 1.3%), Pima ($77,431, a difference of 1.6%), and Immigrants from Yemen ($77,457, a difference of 1.7%).
| Demographics | Rating | Rank | Median Family Income |
| Kiowa | 0.0 /100 | #333 | Tragic $80,885 |
| Menominee | 0.0 /100 | #334 | Tragic $79,563 |
| Yup'ik | 0.0 /100 | #335 | Tragic $79,290 |
| Immigrants | Cuba | 0.0 /100 | #336 | Tragic $78,249 |
| Yuman | 0.0 /100 | #337 | Tragic $78,055 |
| Immigrants | Yemen | 0.0 /100 | #338 | Tragic $77,457 |
| Pima | 0.0 /100 | #339 | Tragic $77,431 |
| Hopi | 0.0 /100 | #340 | Tragic $77,188 |
| Pueblo | 0.0 /100 | #341 | Tragic $76,880 |
| Crow | 0.0 /100 | #342 | Tragic $76,605 |
| Houma | 0.0 /100 | #343 | Tragic $76,188 |
| Tohono O'odham | 0.0 /100 | #344 | Tragic $72,193 |
| Navajo | 0.0 /100 | #345 | Tragic $70,989 |
| Puerto Ricans | 0.0 /100 | #346 | Tragic $70,423 |
| Lumbee | 0.0 /100 | #347 | Tragic $68,679 |
Demographics Similar to Immigrants from Fiji by Median Family Income
In terms of median family income, the demographic groups most similar to Immigrants from Fiji are Ugandan ($106,541, a difference of 0.0%), Canadian ($106,597, a difference of 0.050%), Immigrants from Oceania ($106,453, a difference of 0.090%), Portuguese ($106,286, a difference of 0.24%), and Immigrants from South Eastern Asia ($106,252, a difference of 0.27%).
| Demographics | Rating | Rank | Median Family Income |
| Taiwanese | 91.4 /100 | #125 | Exceptional $107,295 |
| Serbians | 90.8 /100 | #126 | Exceptional $107,157 |
| Lebanese | 90.5 /100 | #127 | Exceptional $107,086 |
| Immigrants | Ethiopia | 90.0 /100 | #128 | Excellent $106,969 |
| Arabs | 89.9 /100 | #129 | Excellent $106,952 |
| Brazilians | 89.8 /100 | #130 | Excellent $106,942 |
| Canadians | 88.1 /100 | #131 | Excellent $106,597 |
| Immigrants | Fiji | 87.8 /100 | #132 | Excellent $106,544 |
| Ugandans | 87.8 /100 | #133 | Excellent $106,541 |
| Immigrants | Oceania | 87.3 /100 | #134 | Excellent $106,453 |
| Portuguese | 86.3 /100 | #135 | Excellent $106,286 |
| Immigrants | South Eastern Asia | 86.1 /100 | #136 | Excellent $106,252 |
| Immigrants | Uganda | 85.7 /100 | #137 | Excellent $106,188 |
| Immigrants | Vietnam | 85.7 /100 | #138 | Excellent $106,186 |
| Luxembourgers | 85.7 /100 | #139 | Excellent $106,183 |