Houma vs Immigrants from Ghana Poverty
COMPARE
Houma
Immigrants from Ghana
Poverty
Poverty Comparison
Houma
Immigrants from Ghana
18.4%
POVERTY
0.0/ 100
METRIC RATING
333rd/ 347
METRIC RANK
14.2%
POVERTY
0.2/ 100
METRIC RATING
249th/ 347
METRIC RANK
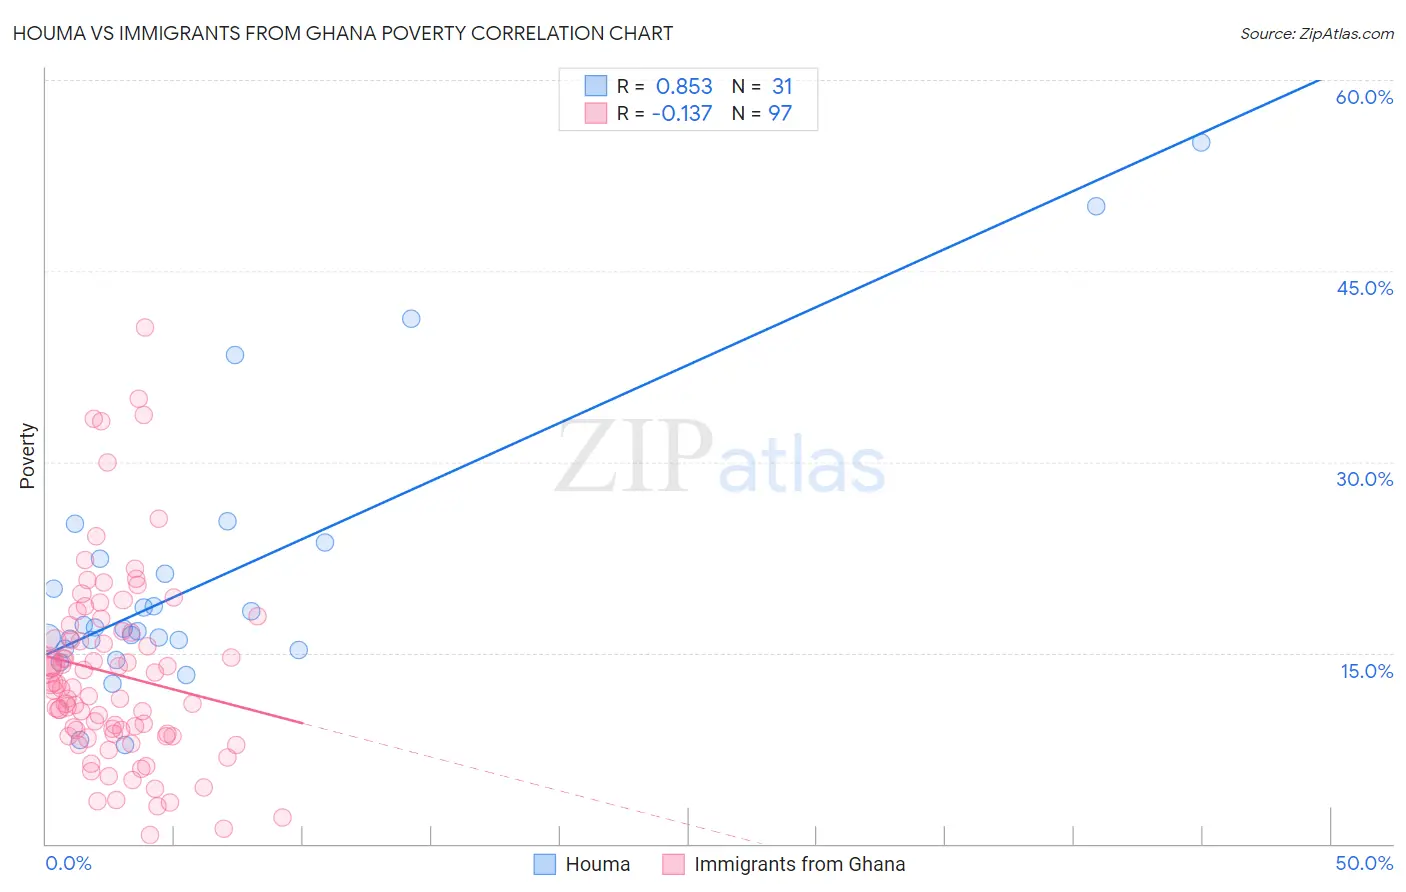
Houma vs Immigrants from Ghana Poverty Correlation Chart
The statistical analysis conducted on geographies consisting of 36,796,778 people shows a very strong positive correlation between the proportion of Houma and poverty level in the United States with a correlation coefficient (R) of 0.853 and weighted average of 18.4%. Similarly, the statistical analysis conducted on geographies consisting of 199,808,032 people shows a poor negative correlation between the proportion of Immigrants from Ghana and poverty level in the United States with a correlation coefficient (R) of -0.137 and weighted average of 14.2%, a difference of 30.1%.
Poverty Correlation Summary
| Measurement | Houma | Immigrants from Ghana |
| Minimum | 7.7% | 0.71% |
| Maximum | 55.1% | 40.5% |
| Range | 47.4% | 39.8% |
| Mean | 20.8% | 13.4% |
| Median | 16.9% | 12.2% |
| Interquartile 25% (IQ1) | 15.3% | 8.5% |
| Interquartile 75% (IQ3) | 22.4% | 16.6% |
| Interquartile Range (IQR) | 7.1% | 8.1% |
| Standard Deviation (Sample) | 11.0% | 7.6% |
| Standard Deviation (Population) | 10.8% | 7.5% |
Similar Demographics by Poverty
Demographics Similar to Houma by Poverty
In terms of poverty, the demographic groups most similar to Houma are Apache (18.4%, a difference of 0.0%), Native/Alaskan (18.1%, a difference of 2.0%), Cheyenne (18.9%, a difference of 2.8%), Immigrants from Dominican Republic (17.8%, a difference of 3.5%), and Dominican (17.6%, a difference of 4.4%).
| Demographics | Rating | Rank | Poverty |
| Paiute | 0.0 /100 | #326 | Tragic 16.7% |
| Kiowa | 0.0 /100 | #327 | Tragic 16.8% |
| Ute | 0.0 /100 | #328 | Tragic 16.9% |
| Blacks/African Americans | 0.0 /100 | #329 | Tragic 17.3% |
| Dominicans | 0.0 /100 | #330 | Tragic 17.6% |
| Immigrants | Dominican Republic | 0.0 /100 | #331 | Tragic 17.8% |
| Natives/Alaskans | 0.0 /100 | #332 | Tragic 18.1% |
| Houma | 0.0 /100 | #333 | Tragic 18.4% |
| Apache | 0.0 /100 | #334 | Tragic 18.4% |
| Cheyenne | 0.0 /100 | #335 | Tragic 18.9% |
| Pueblo | 0.0 /100 | #336 | Tragic 19.4% |
| Sioux | 0.0 /100 | #337 | Tragic 19.8% |
| Yuman | 0.0 /100 | #338 | Tragic 20.2% |
| Crow | 0.0 /100 | #339 | Tragic 20.7% |
| Yup'ik | 0.0 /100 | #340 | Tragic 20.8% |
Demographics Similar to Immigrants from Ghana by Poverty
In terms of poverty, the demographic groups most similar to Immigrants from Ghana are Immigrants from Western Africa (14.1%, a difference of 0.090%), Liberian (14.1%, a difference of 0.11%), Cree (14.2%, a difference of 0.30%), Immigrants from Burma/Myanmar (14.2%, a difference of 0.39%), and Potawatomi (14.1%, a difference of 0.40%).
| Demographics | Rating | Rank | Poverty |
| Ecuadorians | 0.4 /100 | #242 | Tragic 14.0% |
| Sudanese | 0.3 /100 | #243 | Tragic 14.0% |
| Nepalese | 0.3 /100 | #244 | Tragic 14.0% |
| Immigrants | Sudan | 0.3 /100 | #245 | Tragic 14.1% |
| Potawatomi | 0.3 /100 | #246 | Tragic 14.1% |
| Liberians | 0.2 /100 | #247 | Tragic 14.1% |
| Immigrants | Western Africa | 0.2 /100 | #248 | Tragic 14.1% |
| Immigrants | Ghana | 0.2 /100 | #249 | Tragic 14.2% |
| Cree | 0.2 /100 | #250 | Tragic 14.2% |
| Immigrants | Burma/Myanmar | 0.2 /100 | #251 | Tragic 14.2% |
| Spanish American Indians | 0.2 /100 | #252 | Tragic 14.2% |
| Immigrants | Trinidad and Tobago | 0.2 /100 | #253 | Tragic 14.2% |
| Immigrants | El Salvador | 0.1 /100 | #254 | Tragic 14.3% |
| Immigrants | Ecuador | 0.1 /100 | #255 | Tragic 14.3% |
| Mexican American Indians | 0.1 /100 | #256 | Tragic 14.3% |