Houma vs Scottish Poverty
COMPARE
Houma
Scottish
Poverty
Poverty Comparison
Houma
Scottish
18.4%
POVERTY
0.0/ 100
METRIC RATING
333rd/ 347
METRIC RANK
11.5%
POVERTY
94.0/ 100
METRIC RATING
100th/ 347
METRIC RANK
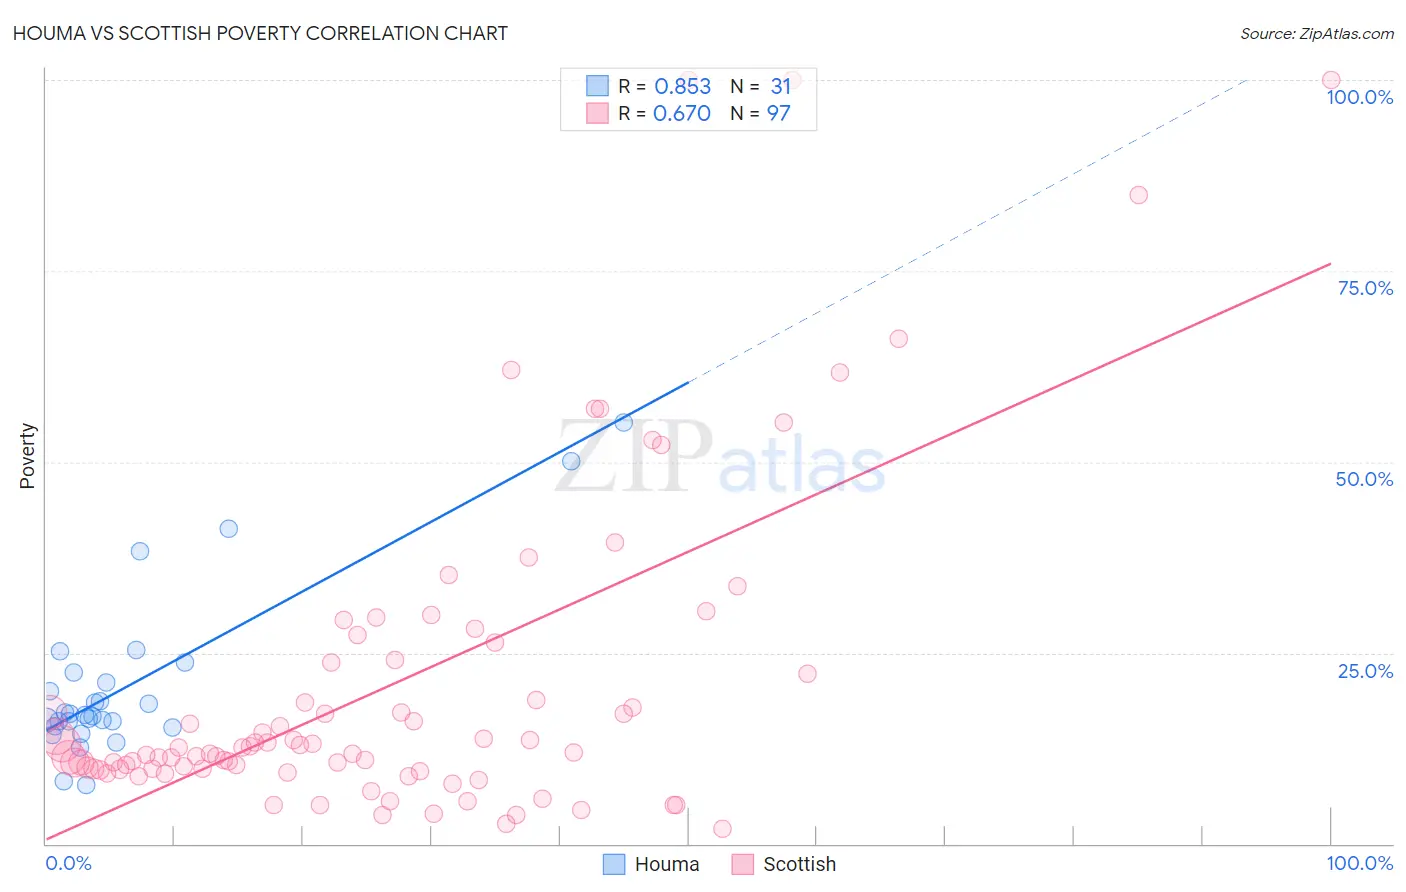
Houma vs Scottish Poverty Correlation Chart
The statistical analysis conducted on geographies consisting of 36,796,778 people shows a very strong positive correlation between the proportion of Houma and poverty level in the United States with a correlation coefficient (R) of 0.853 and weighted average of 18.4%. Similarly, the statistical analysis conducted on geographies consisting of 566,309,495 people shows a significant positive correlation between the proportion of Scottish and poverty level in the United States with a correlation coefficient (R) of 0.670 and weighted average of 11.5%, a difference of 60.3%.
Poverty Correlation Summary
| Measurement | Houma | Scottish |
| Minimum | 7.7% | 1.9% |
| Maximum | 55.1% | 100.0% |
| Range | 47.4% | 98.1% |
| Mean | 20.8% | 20.9% |
| Median | 16.9% | 12.6% |
| Interquartile 25% (IQ1) | 15.3% | 9.8% |
| Interquartile 75% (IQ3) | 22.4% | 23.9% |
| Interquartile Range (IQR) | 7.1% | 14.1% |
| Standard Deviation (Sample) | 11.0% | 21.4% |
| Standard Deviation (Population) | 10.8% | 21.3% |
Similar Demographics by Poverty
Demographics Similar to Houma by Poverty
In terms of poverty, the demographic groups most similar to Houma are Apache (18.4%, a difference of 0.0%), Native/Alaskan (18.1%, a difference of 2.0%), Cheyenne (18.9%, a difference of 2.8%), Immigrants from Dominican Republic (17.8%, a difference of 3.5%), and Dominican (17.6%, a difference of 4.4%).
| Demographics | Rating | Rank | Poverty |
| Paiute | 0.0 /100 | #326 | Tragic 16.7% |
| Kiowa | 0.0 /100 | #327 | Tragic 16.8% |
| Ute | 0.0 /100 | #328 | Tragic 16.9% |
| Blacks/African Americans | 0.0 /100 | #329 | Tragic 17.3% |
| Dominicans | 0.0 /100 | #330 | Tragic 17.6% |
| Immigrants | Dominican Republic | 0.0 /100 | #331 | Tragic 17.8% |
| Natives/Alaskans | 0.0 /100 | #332 | Tragic 18.1% |
| Houma | 0.0 /100 | #333 | Tragic 18.4% |
| Apache | 0.0 /100 | #334 | Tragic 18.4% |
| Cheyenne | 0.0 /100 | #335 | Tragic 18.9% |
| Pueblo | 0.0 /100 | #336 | Tragic 19.4% |
| Sioux | 0.0 /100 | #337 | Tragic 19.8% |
| Yuman | 0.0 /100 | #338 | Tragic 20.2% |
| Crow | 0.0 /100 | #339 | Tragic 20.7% |
| Yup'ik | 0.0 /100 | #340 | Tragic 20.8% |
Demographics Similar to Scottish by Poverty
In terms of poverty, the demographic groups most similar to Scottish are Immigrants from Indonesia (11.5%, a difference of 0.11%), Immigrants from Latvia (11.5%, a difference of 0.24%), Immigrants from Egypt (11.5%, a difference of 0.28%), Immigrants from South Africa (11.5%, a difference of 0.31%), and Slavic (11.5%, a difference of 0.31%).
| Demographics | Rating | Rank | Poverty |
| Romanians | 94.9 /100 | #93 | Exceptional 11.4% |
| Paraguayans | 94.9 /100 | #94 | Exceptional 11.4% |
| Australians | 94.9 /100 | #95 | Exceptional 11.4% |
| Immigrants | South Africa | 94.7 /100 | #96 | Exceptional 11.5% |
| Immigrants | Egypt | 94.6 /100 | #97 | Exceptional 11.5% |
| Immigrants | Latvia | 94.5 /100 | #98 | Exceptional 11.5% |
| Immigrants | Indonesia | 94.2 /100 | #99 | Exceptional 11.5% |
| Scottish | 94.0 /100 | #100 | Exceptional 11.5% |
| Slavs | 93.3 /100 | #101 | Exceptional 11.5% |
| Laotians | 92.4 /100 | #102 | Exceptional 11.6% |
| Okinawans | 92.4 /100 | #103 | Exceptional 11.6% |
| Native Hawaiians | 92.1 /100 | #104 | Exceptional 11.6% |
| Portuguese | 92.1 /100 | #105 | Exceptional 11.6% |
| Immigrants | Zimbabwe | 92.1 /100 | #106 | Exceptional 11.6% |
| Palestinians | 91.8 /100 | #107 | Exceptional 11.6% |