Houma vs Immigrants from Fiji GED/Equivalency
COMPARE
Houma
Immigrants from Fiji
GED/Equivalency
GED/Equivalency Comparison
Houma
Immigrants from Fiji
75.0%
GED/EQUIVALENCY
0.0/ 100
METRIC RATING
346th/ 347
METRIC RANK
82.7%
GED/EQUIVALENCY
0.1/ 100
METRIC RATING
279th/ 347
METRIC RANK
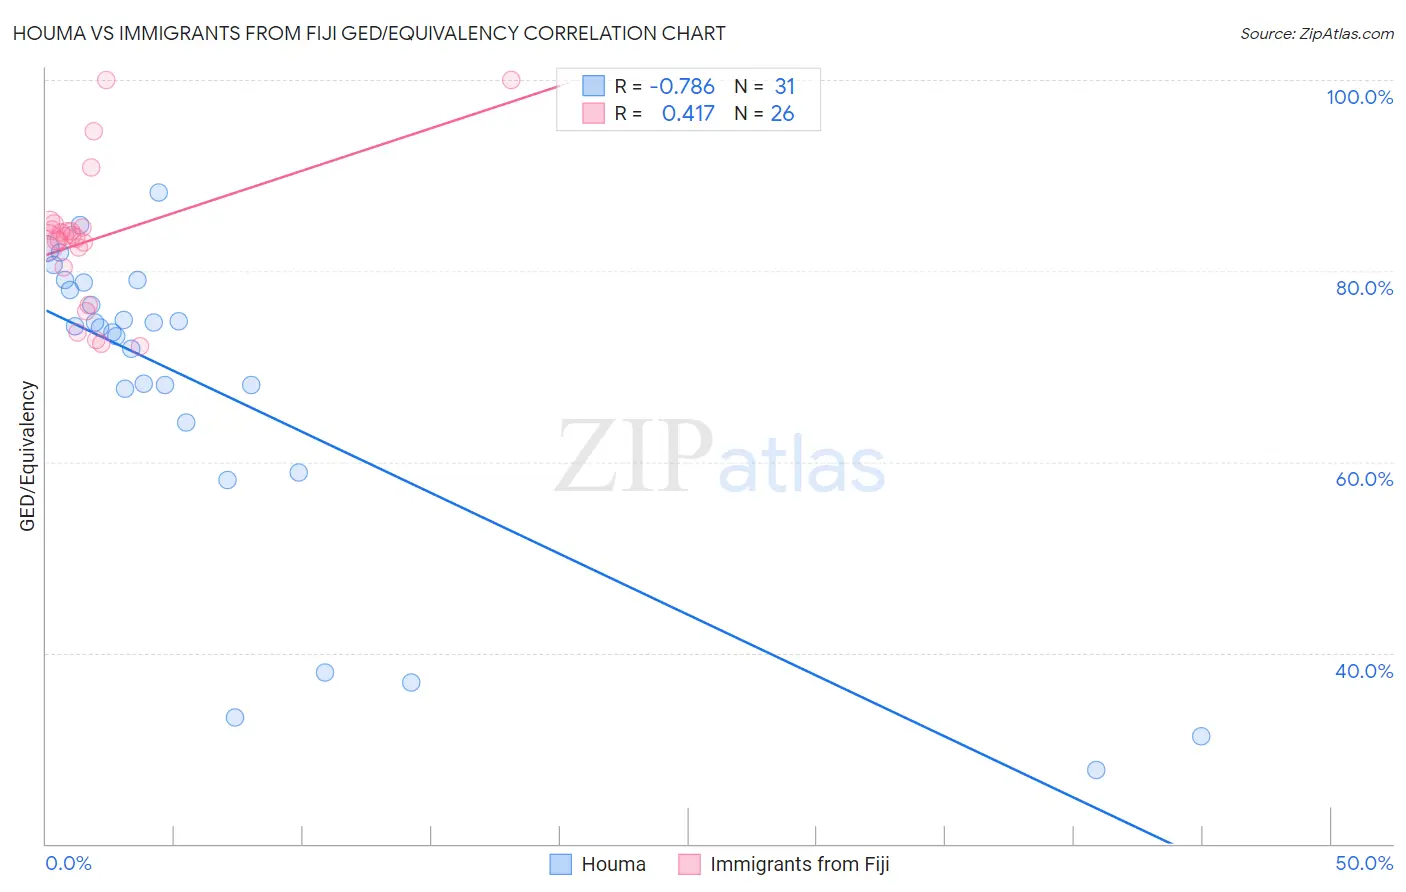
Houma vs Immigrants from Fiji GED/Equivalency Correlation Chart
The statistical analysis conducted on geographies consisting of 36,795,916 people shows a strong negative correlation between the proportion of Houma and percentage of population with at least ged/equivalency education in the United States with a correlation coefficient (R) of -0.786 and weighted average of 75.0%. Similarly, the statistical analysis conducted on geographies consisting of 93,756,204 people shows a moderate positive correlation between the proportion of Immigrants from Fiji and percentage of population with at least ged/equivalency education in the United States with a correlation coefficient (R) of 0.417 and weighted average of 82.7%, a difference of 10.3%.
GED/Equivalency Correlation Summary
| Measurement | Houma | Immigrants from Fiji |
| Minimum | 27.8% | 72.1% |
| Maximum | 88.2% | 100.0% |
| Range | 60.4% | 27.9% |
| Mean | 67.6% | 83.3% |
| Median | 74.1% | 83.6% |
| Interquartile 25% (IQ1) | 64.2% | 80.4% |
| Interquartile 75% (IQ3) | 78.8% | 84.6% |
| Interquartile Range (IQR) | 14.6% | 4.2% |
| Standard Deviation (Sample) | 16.7% | 7.3% |
| Standard Deviation (Population) | 16.4% | 7.1% |
Similar Demographics by GED/Equivalency
Demographics Similar to Houma by GED/Equivalency
In terms of ged/equivalency, the demographic groups most similar to Houma are Yakama (74.5%, a difference of 0.61%), Immigrants from Mexico (75.7%, a difference of 0.94%), Spanish American Indian (76.3%, a difference of 1.8%), Immigrants from Central America (76.4%, a difference of 1.9%), and Pima (76.4%, a difference of 2.0%).
| Demographics | Rating | Rank | GED/Equivalency |
| Salvadorans | 0.0 /100 | #333 | Tragic 78.6% |
| Guatemalans | 0.0 /100 | #334 | Tragic 78.5% |
| Immigrants | Latin America | 0.0 /100 | #335 | Tragic 78.5% |
| Immigrants | Dominican Republic | 0.0 /100 | #336 | Tragic 78.0% |
| Immigrants | Yemen | 0.0 /100 | #337 | Tragic 77.9% |
| Immigrants | Guatemala | 0.0 /100 | #338 | Tragic 77.9% |
| Immigrants | El Salvador | 0.0 /100 | #339 | Tragic 77.6% |
| Tohono O'odham | 0.0 /100 | #340 | Tragic 77.5% |
| Mexicans | 0.0 /100 | #341 | Tragic 77.4% |
| Pima | 0.0 /100 | #342 | Tragic 76.4% |
| Immigrants | Central America | 0.0 /100 | #343 | Tragic 76.4% |
| Spanish American Indians | 0.0 /100 | #344 | Tragic 76.3% |
| Immigrants | Mexico | 0.0 /100 | #345 | Tragic 75.7% |
| Houma | 0.0 /100 | #346 | Tragic 75.0% |
| Yakama | 0.0 /100 | #347 | Tragic 74.5% |
Demographics Similar to Immigrants from Fiji by GED/Equivalency
In terms of ged/equivalency, the demographic groups most similar to Immigrants from Fiji are Immigrants from Laos (82.7%, a difference of 0.010%), Cheyenne (82.7%, a difference of 0.010%), Arapaho (82.8%, a difference of 0.040%), Black/African American (82.8%, a difference of 0.060%), and Seminole (82.8%, a difference of 0.080%).
| Demographics | Rating | Rank | GED/Equivalency |
| Barbadians | 0.1 /100 | #272 | Tragic 82.9% |
| Pennsylvania Germans | 0.1 /100 | #273 | Tragic 82.9% |
| Immigrants | Trinidad and Tobago | 0.1 /100 | #274 | Tragic 82.8% |
| Seminole | 0.1 /100 | #275 | Tragic 82.8% |
| Blacks/African Americans | 0.1 /100 | #276 | Tragic 82.8% |
| Arapaho | 0.1 /100 | #277 | Tragic 82.8% |
| Immigrants | Laos | 0.1 /100 | #278 | Tragic 82.7% |
| Immigrants | Fiji | 0.1 /100 | #279 | Tragic 82.7% |
| Cheyenne | 0.1 /100 | #280 | Tragic 82.7% |
| Sioux | 0.1 /100 | #281 | Tragic 82.6% |
| Immigrants | Immigrants | 0.1 /100 | #282 | Tragic 82.6% |
| Indonesians | 0.1 /100 | #283 | Tragic 82.5% |
| Immigrants | Barbados | 0.1 /100 | #284 | Tragic 82.4% |
| Cajuns | 0.0 /100 | #285 | Tragic 82.4% |
| Immigrants | West Indies | 0.0 /100 | #286 | Tragic 82.4% |