Hopi vs Tsimshian Female Poverty
COMPARE
Hopi
Tsimshian
Female Poverty
Female Poverty Comparison
Hopi
Tsimshian
21.0%
FEMALE POVERTY
0.0/ 100
METRIC RATING
339th/ 347
METRIC RANK
13.1%
FEMALE POVERTY
75.5/ 100
METRIC RATING
150th/ 347
METRIC RANK
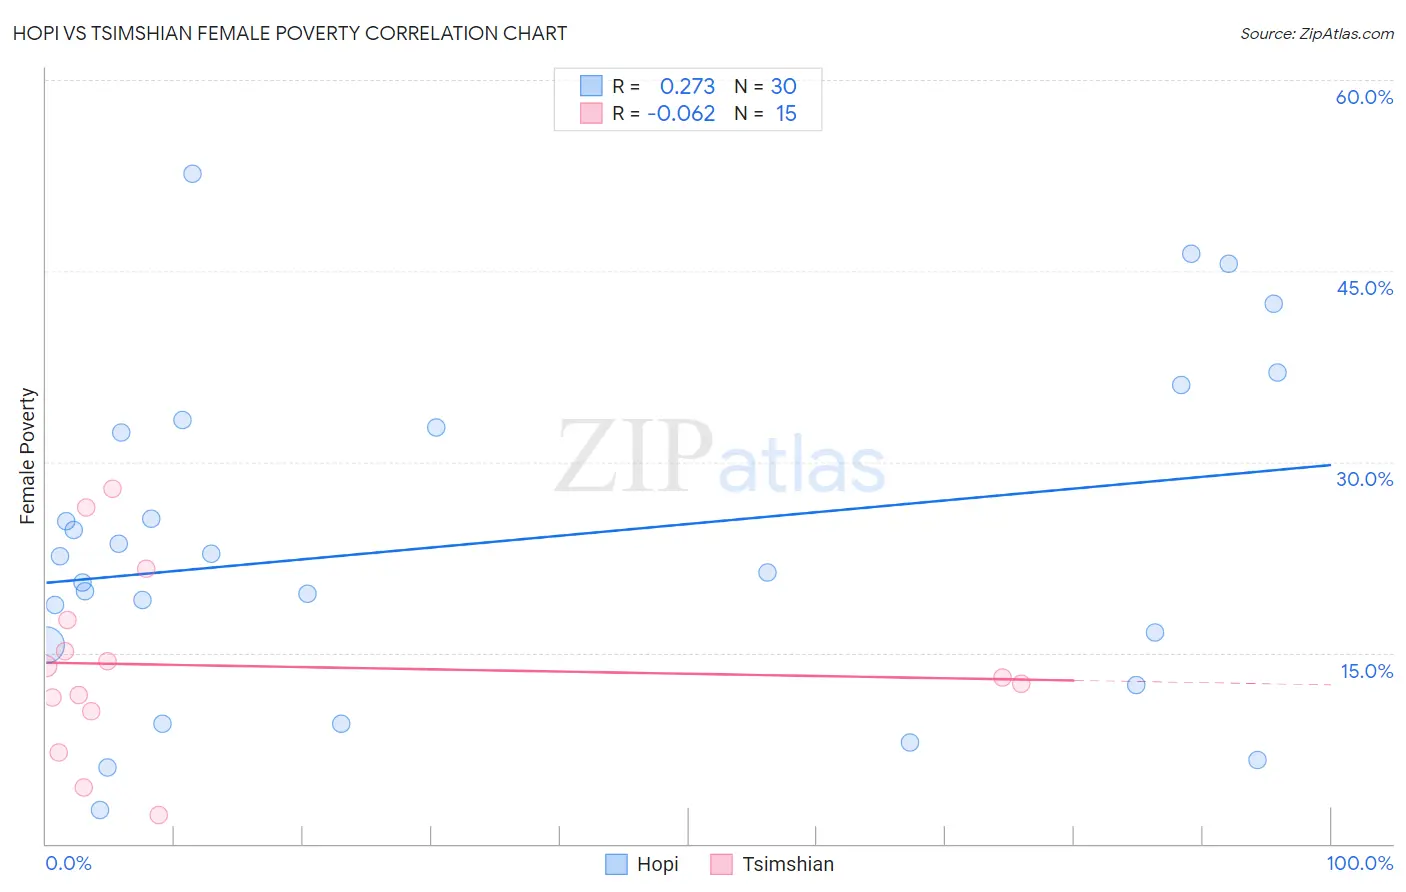
Hopi vs Tsimshian Female Poverty Correlation Chart
The statistical analysis conducted on geographies consisting of 74,730,236 people shows a weak positive correlation between the proportion of Hopi and poverty level among females in the United States with a correlation coefficient (R) of 0.273 and weighted average of 21.0%. Similarly, the statistical analysis conducted on geographies consisting of 15,626,462 people shows a slight negative correlation between the proportion of Tsimshian and poverty level among females in the United States with a correlation coefficient (R) of -0.062 and weighted average of 13.1%, a difference of 60.3%.
Female Poverty Correlation Summary
| Measurement | Hopi | Tsimshian |
| Minimum | 2.6% | 2.2% |
| Maximum | 52.7% | 27.8% |
| Range | 50.0% | 25.6% |
| Mean | 23.6% | 14.0% |
| Median | 22.0% | 13.1% |
| Interquartile 25% (IQ1) | 15.6% | 10.4% |
| Interquartile 75% (IQ3) | 32.7% | 17.6% |
| Interquartile Range (IQR) | 17.1% | 7.2% |
| Standard Deviation (Sample) | 12.9% | 7.2% |
| Standard Deviation (Population) | 12.7% | 6.9% |
Similar Demographics by Female Poverty
Demographics Similar to Hopi by Female Poverty
In terms of female poverty, the demographic groups most similar to Hopi are Sioux (20.9%, a difference of 0.37%), Yuman (20.8%, a difference of 0.56%), Pueblo (20.7%, a difference of 1.4%), Yup'ik (21.5%, a difference of 2.5%), and Cheyenne (20.2%, a difference of 3.8%).
| Demographics | Rating | Rank | Female Poverty |
| Apache | 0.0 /100 | #332 | Tragic 19.2% |
| Immigrants | Dominican Republic | 0.0 /100 | #333 | Tragic 19.3% |
| Houma | 0.0 /100 | #334 | Tragic 20.0% |
| Cheyenne | 0.0 /100 | #335 | Tragic 20.2% |
| Pueblo | 0.0 /100 | #336 | Tragic 20.7% |
| Yuman | 0.0 /100 | #337 | Tragic 20.8% |
| Sioux | 0.0 /100 | #338 | Tragic 20.9% |
| Hopi | 0.0 /100 | #339 | Tragic 21.0% |
| Yup'ik | 0.0 /100 | #340 | Tragic 21.5% |
| Crow | 0.0 /100 | #341 | Tragic 22.1% |
| Immigrants | Yemen | 0.0 /100 | #342 | Tragic 22.8% |
| Lumbee | 0.0 /100 | #343 | Tragic 23.5% |
| Pima | 0.0 /100 | #344 | Tragic 23.6% |
| Navajo | 0.0 /100 | #345 | Tragic 23.9% |
| Puerto Ricans | 0.0 /100 | #346 | Tragic 25.2% |
Demographics Similar to Tsimshian by Female Poverty
In terms of female poverty, the demographic groups most similar to Tsimshian are Taiwanese (13.1%, a difference of 0.030%), Immigrants from Germany (13.1%, a difference of 0.070%), Yugoslavian (13.1%, a difference of 0.19%), Samoan (13.1%, a difference of 0.24%), and Immigrants from Kazakhstan (13.0%, a difference of 0.44%).
| Demographics | Rating | Rank | Female Poverty |
| Immigrants | Malaysia | 80.4 /100 | #143 | Excellent 13.0% |
| Afghans | 79.8 /100 | #144 | Good 13.0% |
| Syrians | 79.6 /100 | #145 | Good 13.0% |
| Immigrants | Peru | 79.1 /100 | #146 | Good 13.0% |
| Immigrants | Kazakhstan | 78.6 /100 | #147 | Good 13.0% |
| Yugoslavians | 76.9 /100 | #148 | Good 13.1% |
| Taiwanese | 75.7 /100 | #149 | Good 13.1% |
| Tsimshian | 75.5 /100 | #150 | Good 13.1% |
| Immigrants | Germany | 74.9 /100 | #151 | Good 13.1% |
| Samoans | 73.6 /100 | #152 | Good 13.1% |
| Immigrants | Fiji | 71.0 /100 | #153 | Good 13.2% |
| Armenians | 70.4 /100 | #154 | Good 13.2% |
| Hungarians | 70.1 /100 | #155 | Good 13.2% |
| Immigrants | Bosnia and Herzegovina | 69.7 /100 | #156 | Good 13.2% |
| Immigrants | Northern Africa | 68.8 /100 | #157 | Good 13.2% |