Hopi vs Indonesian Female Poverty
COMPARE
Hopi
Indonesian
Female Poverty
Female Poverty Comparison
Hopi
Indonesians
21.0%
FEMALE POVERTY
0.0/ 100
METRIC RATING
339th/ 347
METRIC RANK
16.4%
FEMALE POVERTY
0.0/ 100
METRIC RATING
288th/ 347
METRIC RANK
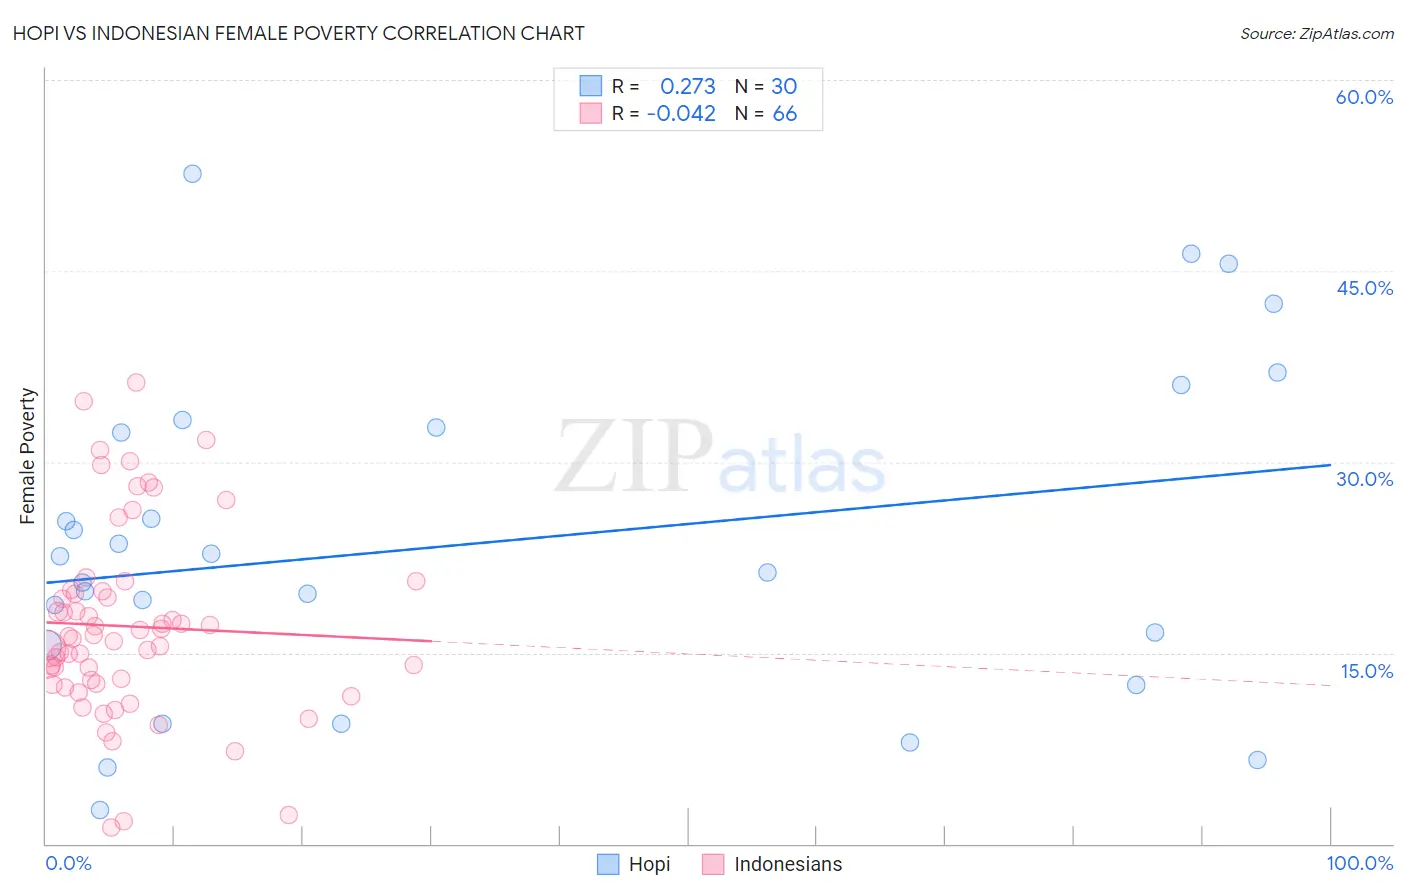
Hopi vs Indonesian Female Poverty Correlation Chart
The statistical analysis conducted on geographies consisting of 74,730,236 people shows a weak positive correlation between the proportion of Hopi and poverty level among females in the United States with a correlation coefficient (R) of 0.273 and weighted average of 21.0%. Similarly, the statistical analysis conducted on geographies consisting of 162,639,231 people shows no correlation between the proportion of Indonesians and poverty level among females in the United States with a correlation coefficient (R) of -0.042 and weighted average of 16.4%, a difference of 28.1%.
Female Poverty Correlation Summary
| Measurement | Hopi | Indonesian |
| Minimum | 2.6% | 1.3% |
| Maximum | 52.7% | 36.2% |
| Range | 50.0% | 34.9% |
| Mean | 23.6% | 17.1% |
| Median | 22.0% | 16.2% |
| Interquartile 25% (IQ1) | 15.6% | 12.6% |
| Interquartile 75% (IQ3) | 32.7% | 19.8% |
| Interquartile Range (IQR) | 17.1% | 7.3% |
| Standard Deviation (Sample) | 12.9% | 7.4% |
| Standard Deviation (Population) | 12.7% | 7.4% |
Similar Demographics by Female Poverty
Demographics Similar to Hopi by Female Poverty
In terms of female poverty, the demographic groups most similar to Hopi are Sioux (20.9%, a difference of 0.37%), Yuman (20.8%, a difference of 0.56%), Pueblo (20.7%, a difference of 1.4%), Yup'ik (21.5%, a difference of 2.5%), and Cheyenne (20.2%, a difference of 3.8%).
| Demographics | Rating | Rank | Female Poverty |
| Apache | 0.0 /100 | #332 | Tragic 19.2% |
| Immigrants | Dominican Republic | 0.0 /100 | #333 | Tragic 19.3% |
| Houma | 0.0 /100 | #334 | Tragic 20.0% |
| Cheyenne | 0.0 /100 | #335 | Tragic 20.2% |
| Pueblo | 0.0 /100 | #336 | Tragic 20.7% |
| Yuman | 0.0 /100 | #337 | Tragic 20.8% |
| Sioux | 0.0 /100 | #338 | Tragic 20.9% |
| Hopi | 0.0 /100 | #339 | Tragic 21.0% |
| Yup'ik | 0.0 /100 | #340 | Tragic 21.5% |
| Crow | 0.0 /100 | #341 | Tragic 22.1% |
| Immigrants | Yemen | 0.0 /100 | #342 | Tragic 22.8% |
| Lumbee | 0.0 /100 | #343 | Tragic 23.5% |
| Pima | 0.0 /100 | #344 | Tragic 23.6% |
| Navajo | 0.0 /100 | #345 | Tragic 23.9% |
| Puerto Ricans | 0.0 /100 | #346 | Tragic 25.2% |
Demographics Similar to Indonesians by Female Poverty
In terms of female poverty, the demographic groups most similar to Indonesians are Blackfeet (16.4%, a difference of 0.010%), Immigrants from Bangladesh (16.4%, a difference of 0.20%), Yaqui (16.4%, a difference of 0.37%), Immigrants from Zaire (16.4%, a difference of 0.38%), and Immigrants from Latin America (16.4%, a difference of 0.43%).
| Demographics | Rating | Rank | Female Poverty |
| West Indians | 0.0 /100 | #281 | Tragic 16.1% |
| Immigrants | Haiti | 0.0 /100 | #282 | Tragic 16.1% |
| Immigrants | Cuba | 0.0 /100 | #283 | Tragic 16.1% |
| Spanish Americans | 0.0 /100 | #284 | Tragic 16.2% |
| Comanche | 0.0 /100 | #285 | Tragic 16.2% |
| Inupiat | 0.0 /100 | #286 | Tragic 16.2% |
| Immigrants | Belize | 0.0 /100 | #287 | Tragic 16.3% |
| Indonesians | 0.0 /100 | #288 | Tragic 16.4% |
| Blackfeet | 0.0 /100 | #289 | Tragic 16.4% |
| Immigrants | Bangladesh | 0.0 /100 | #290 | Tragic 16.4% |
| Yaqui | 0.0 /100 | #291 | Tragic 16.4% |
| Immigrants | Zaire | 0.0 /100 | #292 | Tragic 16.4% |
| Immigrants | Latin America | 0.0 /100 | #293 | Tragic 16.4% |
| Immigrants | Cabo Verde | 0.0 /100 | #294 | Tragic 16.4% |
| Senegalese | 0.0 /100 | #295 | Tragic 16.5% |