Immigrants from Guatemala vs Tsimshian Female Poverty
COMPARE
Immigrants from Guatemala
Tsimshian
Female Poverty
Female Poverty Comparison
Immigrants from Guatemala
Tsimshian
17.0%
FEMALE POVERTY
0.0/ 100
METRIC RATING
311th/ 347
METRIC RANK
13.1%
FEMALE POVERTY
75.5/ 100
METRIC RATING
150th/ 347
METRIC RANK
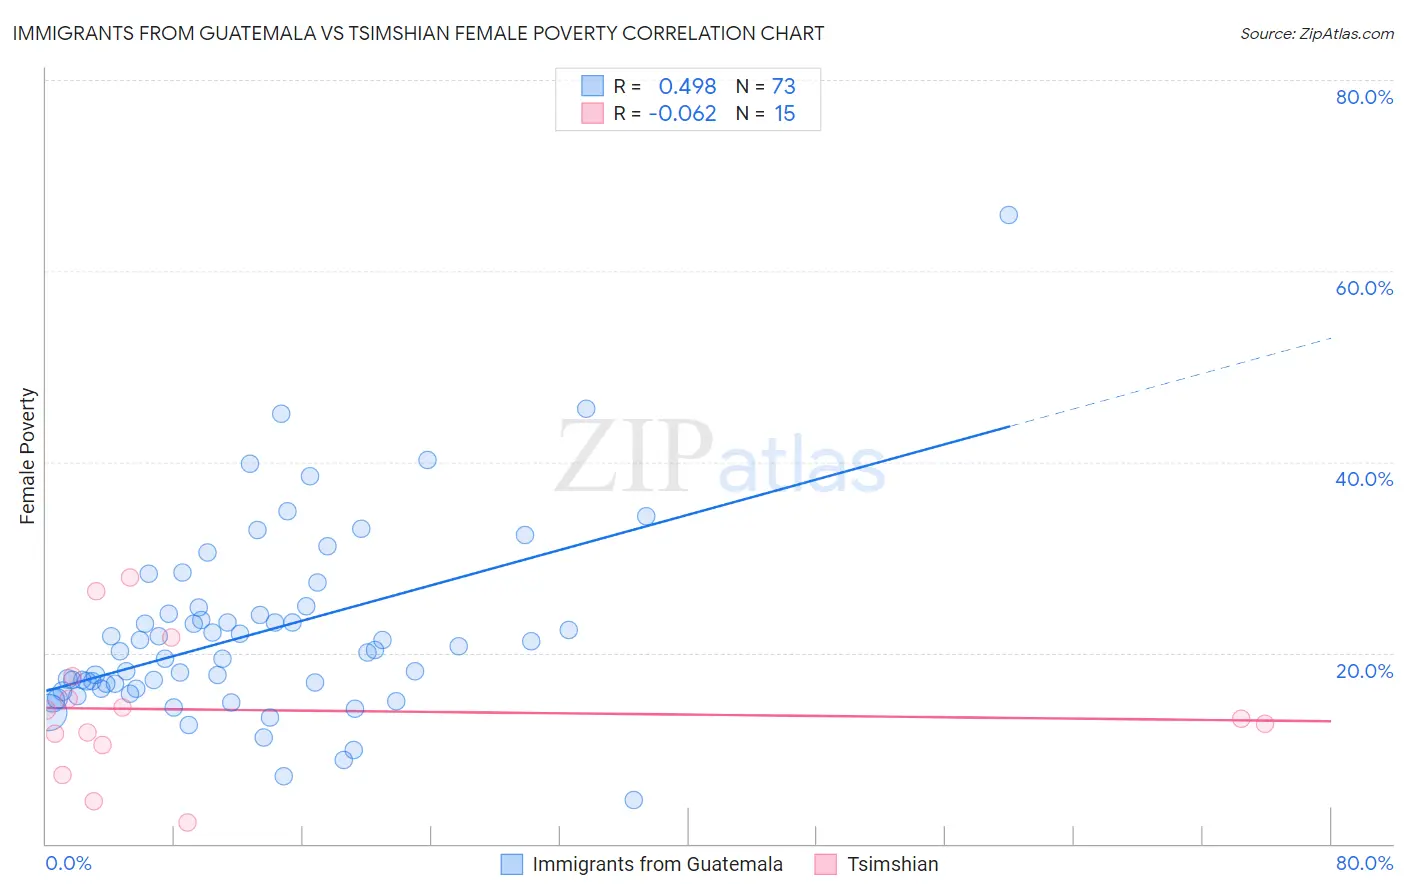
Immigrants from Guatemala vs Tsimshian Female Poverty Correlation Chart
The statistical analysis conducted on geographies consisting of 377,104,369 people shows a moderate positive correlation between the proportion of Immigrants from Guatemala and poverty level among females in the United States with a correlation coefficient (R) of 0.498 and weighted average of 17.0%. Similarly, the statistical analysis conducted on geographies consisting of 15,626,462 people shows a slight negative correlation between the proportion of Tsimshian and poverty level among females in the United States with a correlation coefficient (R) of -0.062 and weighted average of 13.1%, a difference of 30.0%.
Female Poverty Correlation Summary
| Measurement | Immigrants from Guatemala | Tsimshian |
| Minimum | 4.6% | 2.2% |
| Maximum | 65.8% | 27.8% |
| Range | 61.2% | 25.6% |
| Mean | 22.1% | 14.0% |
| Median | 20.2% | 13.1% |
| Interquartile 25% (IQ1) | 16.3% | 10.4% |
| Interquartile 75% (IQ3) | 24.4% | 17.6% |
| Interquartile Range (IQR) | 8.2% | 7.2% |
| Standard Deviation (Sample) | 9.8% | 7.2% |
| Standard Deviation (Population) | 9.7% | 6.9% |
Similar Demographics by Female Poverty
Demographics Similar to Immigrants from Guatemala by Female Poverty
In terms of female poverty, the demographic groups most similar to Immigrants from Guatemala are Creek (17.0%, a difference of 0.0%), Immigrants from Somalia (17.0%, a difference of 0.090%), British West Indian (17.0%, a difference of 0.17%), Immigrants from Mexico (17.0%, a difference of 0.24%), and Dutch West Indian (17.1%, a difference of 0.42%).
| Demographics | Rating | Rank | Female Poverty |
| Immigrants | Central America | 0.0 /100 | #304 | Tragic 16.8% |
| Immigrants | Grenada | 0.0 /100 | #305 | Tragic 16.8% |
| Immigrants | Caribbean | 0.0 /100 | #306 | Tragic 16.9% |
| Seminole | 0.0 /100 | #307 | Tragic 16.9% |
| Africans | 0.0 /100 | #308 | Tragic 16.9% |
| Immigrants | Mexico | 0.0 /100 | #309 | Tragic 17.0% |
| Creek | 0.0 /100 | #310 | Tragic 17.0% |
| Immigrants | Guatemala | 0.0 /100 | #311 | Tragic 17.0% |
| Immigrants | Somalia | 0.0 /100 | #312 | Tragic 17.0% |
| British West Indians | 0.0 /100 | #313 | Tragic 17.0% |
| Dutch West Indians | 0.0 /100 | #314 | Tragic 17.1% |
| U.S. Virgin Islanders | 0.0 /100 | #315 | Tragic 17.3% |
| Hondurans | 0.0 /100 | #316 | Tragic 17.4% |
| Immigrants | Congo | 0.0 /100 | #317 | Tragic 17.4% |
| Ute | 0.0 /100 | #318 | Tragic 17.5% |
Demographics Similar to Tsimshian by Female Poverty
In terms of female poverty, the demographic groups most similar to Tsimshian are Taiwanese (13.1%, a difference of 0.030%), Immigrants from Germany (13.1%, a difference of 0.070%), Yugoslavian (13.1%, a difference of 0.19%), Samoan (13.1%, a difference of 0.24%), and Immigrants from Kazakhstan (13.0%, a difference of 0.44%).
| Demographics | Rating | Rank | Female Poverty |
| Immigrants | Malaysia | 80.4 /100 | #143 | Excellent 13.0% |
| Afghans | 79.8 /100 | #144 | Good 13.0% |
| Syrians | 79.6 /100 | #145 | Good 13.0% |
| Immigrants | Peru | 79.1 /100 | #146 | Good 13.0% |
| Immigrants | Kazakhstan | 78.6 /100 | #147 | Good 13.0% |
| Yugoslavians | 76.9 /100 | #148 | Good 13.1% |
| Taiwanese | 75.7 /100 | #149 | Good 13.1% |
| Tsimshian | 75.5 /100 | #150 | Good 13.1% |
| Immigrants | Germany | 74.9 /100 | #151 | Good 13.1% |
| Samoans | 73.6 /100 | #152 | Good 13.1% |
| Immigrants | Fiji | 71.0 /100 | #153 | Good 13.2% |
| Armenians | 70.4 /100 | #154 | Good 13.2% |
| Hungarians | 70.1 /100 | #155 | Good 13.2% |
| Immigrants | Bosnia and Herzegovina | 69.7 /100 | #156 | Good 13.2% |
| Immigrants | Northern Africa | 68.8 /100 | #157 | Good 13.2% |