Hopi vs Immigrants from Korea Single Female Poverty
COMPARE
Hopi
Immigrants from Korea
Single Female Poverty
Single Female Poverty Comparison
Hopi
Immigrants from Korea
28.0%
SINGLE FEMALE POVERTY
0.0/ 100
METRIC RATING
330th/ 347
METRIC RANK
18.1%
SINGLE FEMALE POVERTY
100.0/ 100
METRIC RATING
17th/ 347
METRIC RANK
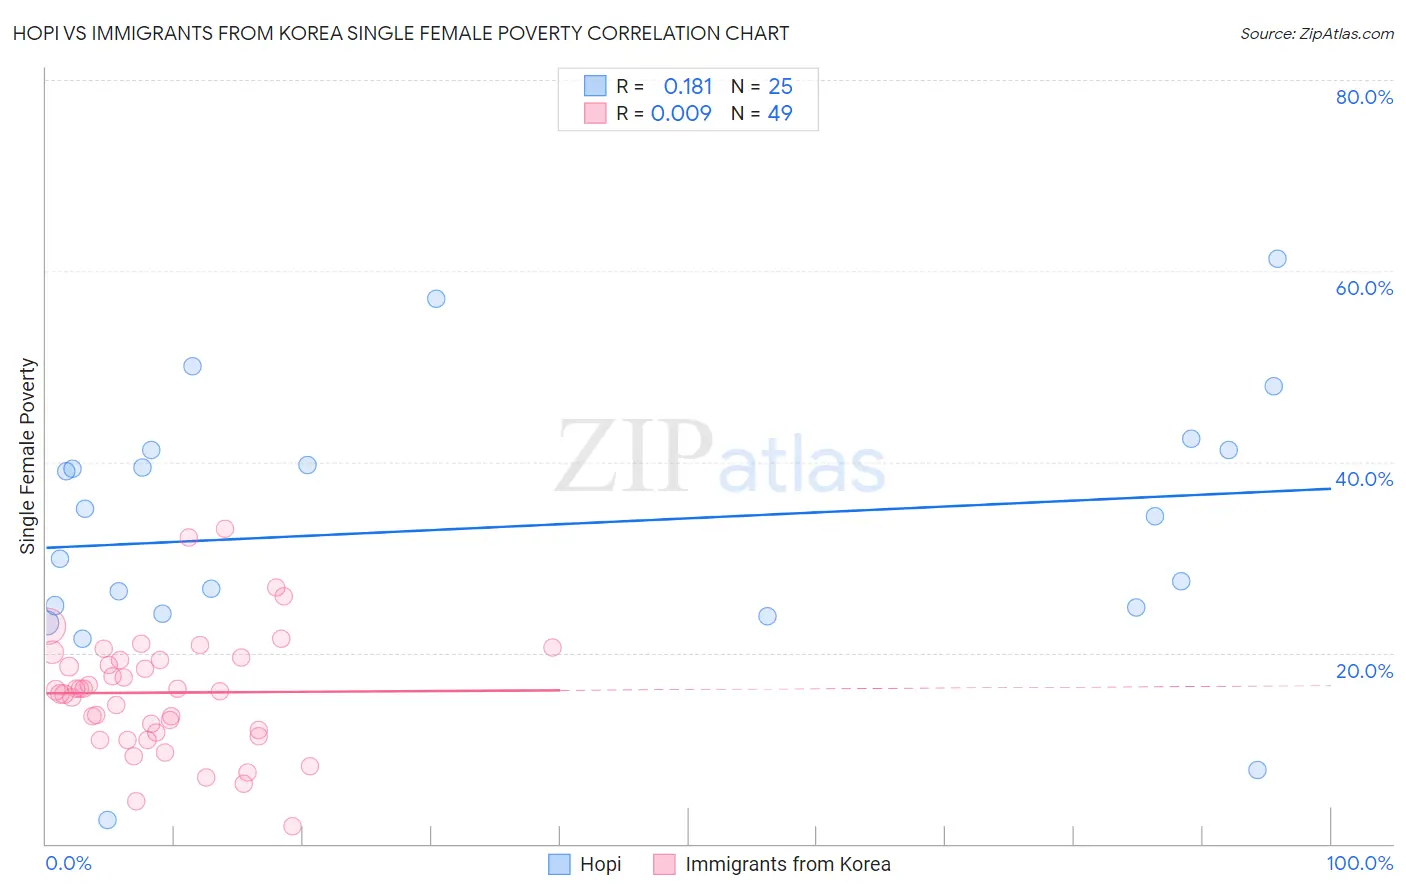
Hopi vs Immigrants from Korea Single Female Poverty Correlation Chart
The statistical analysis conducted on geographies consisting of 74,526,987 people shows a poor positive correlation between the proportion of Hopi and poverty level among single females in the United States with a correlation coefficient (R) of 0.181 and weighted average of 28.0%. Similarly, the statistical analysis conducted on geographies consisting of 408,307,529 people shows no correlation between the proportion of Immigrants from Korea and poverty level among single females in the United States with a correlation coefficient (R) of 0.009 and weighted average of 18.1%, a difference of 55.0%.
Single Female Poverty Correlation Summary
| Measurement | Hopi | Immigrants from Korea |
| Minimum | 2.4% | 1.8% |
| Maximum | 61.3% | 33.0% |
| Range | 58.9% | 31.2% |
| Mean | 33.2% | 15.8% |
| Median | 34.3% | 16.1% |
| Interquartile 25% (IQ1) | 24.4% | 11.4% |
| Interquartile 75% (IQ3) | 41.2% | 19.4% |
| Interquartile Range (IQR) | 16.8% | 8.0% |
| Standard Deviation (Sample) | 13.7% | 6.3% |
| Standard Deviation (Population) | 13.4% | 6.3% |
Similar Demographics by Single Female Poverty
Demographics Similar to Hopi by Single Female Poverty
In terms of single female poverty, the demographic groups most similar to Hopi are Native/Alaskan (28.2%, a difference of 0.64%), Menominee (27.8%, a difference of 0.71%), Yakama (28.3%, a difference of 0.90%), Apache (27.7%, a difference of 1.2%), and Ute (28.4%, a difference of 1.3%).
| Demographics | Rating | Rank | Single Female Poverty |
| Chippewa | 0.0 /100 | #323 | Tragic 26.8% |
| Kiowa | 0.0 /100 | #324 | Tragic 26.9% |
| Choctaw | 0.0 /100 | #325 | Tragic 27.2% |
| Creek | 0.0 /100 | #326 | Tragic 27.4% |
| Dutch West Indians | 0.0 /100 | #327 | Tragic 27.5% |
| Apache | 0.0 /100 | #328 | Tragic 27.7% |
| Menominee | 0.0 /100 | #329 | Tragic 27.8% |
| Hopi | 0.0 /100 | #330 | Tragic 28.0% |
| Natives/Alaskans | 0.0 /100 | #331 | Tragic 28.2% |
| Yakama | 0.0 /100 | #332 | Tragic 28.3% |
| Ute | 0.0 /100 | #333 | Tragic 28.4% |
| Pueblo | 0.0 /100 | #334 | Tragic 28.6% |
| Immigrants | Yemen | 0.0 /100 | #335 | Tragic 28.9% |
| Colville | 0.0 /100 | #336 | Tragic 29.1% |
| Yuman | 0.0 /100 | #337 | Tragic 29.4% |
Demographics Similar to Immigrants from Korea by Single Female Poverty
In terms of single female poverty, the demographic groups most similar to Immigrants from Korea are Immigrants from Eastern Asia (18.1%, a difference of 0.28%), Immigrants from China (18.1%, a difference of 0.32%), Iranian (18.0%, a difference of 0.60%), Indian (Asian) (17.9%, a difference of 0.76%), and Bolivian (17.9%, a difference of 0.90%).
| Demographics | Rating | Rank | Single Female Poverty |
| Immigrants | Ireland | 100.0 /100 | #10 | Exceptional 17.8% |
| Immigrants | Lithuania | 100.0 /100 | #11 | Exceptional 17.8% |
| Immigrants | South Central Asia | 100.0 /100 | #12 | Exceptional 17.8% |
| Immigrants | Bolivia | 100.0 /100 | #13 | Exceptional 17.8% |
| Bolivians | 100.0 /100 | #14 | Exceptional 17.9% |
| Indians (Asian) | 100.0 /100 | #15 | Exceptional 17.9% |
| Iranians | 100.0 /100 | #16 | Exceptional 18.0% |
| Immigrants | Korea | 100.0 /100 | #17 | Exceptional 18.1% |
| Immigrants | Eastern Asia | 100.0 /100 | #18 | Exceptional 18.1% |
| Immigrants | China | 100.0 /100 | #19 | Exceptional 18.1% |
| Immigrants | Greece | 100.0 /100 | #20 | Exceptional 18.3% |
| Maltese | 100.0 /100 | #21 | Exceptional 18.3% |
| Burmese | 100.0 /100 | #22 | Exceptional 18.3% |
| Asians | 100.0 /100 | #23 | Exceptional 18.3% |
| Armenians | 100.0 /100 | #24 | Exceptional 18.3% |