Hopi vs Puget Sound Salish Unemployment Among Ages 25 to 29 years
COMPARE
Hopi
Puget Sound Salish
Unemployment Among Ages 25 to 29 years
Unemployment Among Ages 25 to 29 years Comparison
Hopi
Puget Sound Salish
13.5%
UNEMPLOYMENT AMONG AGES 25 TO 29 YEARS
0.0/ 100
METRIC RATING
344th/ 347
METRIC RANK
7.1%
UNEMPLOYMENT AMONG AGES 25 TO 29 YEARS
1.8/ 100
METRIC RATING
237th/ 347
METRIC RANK
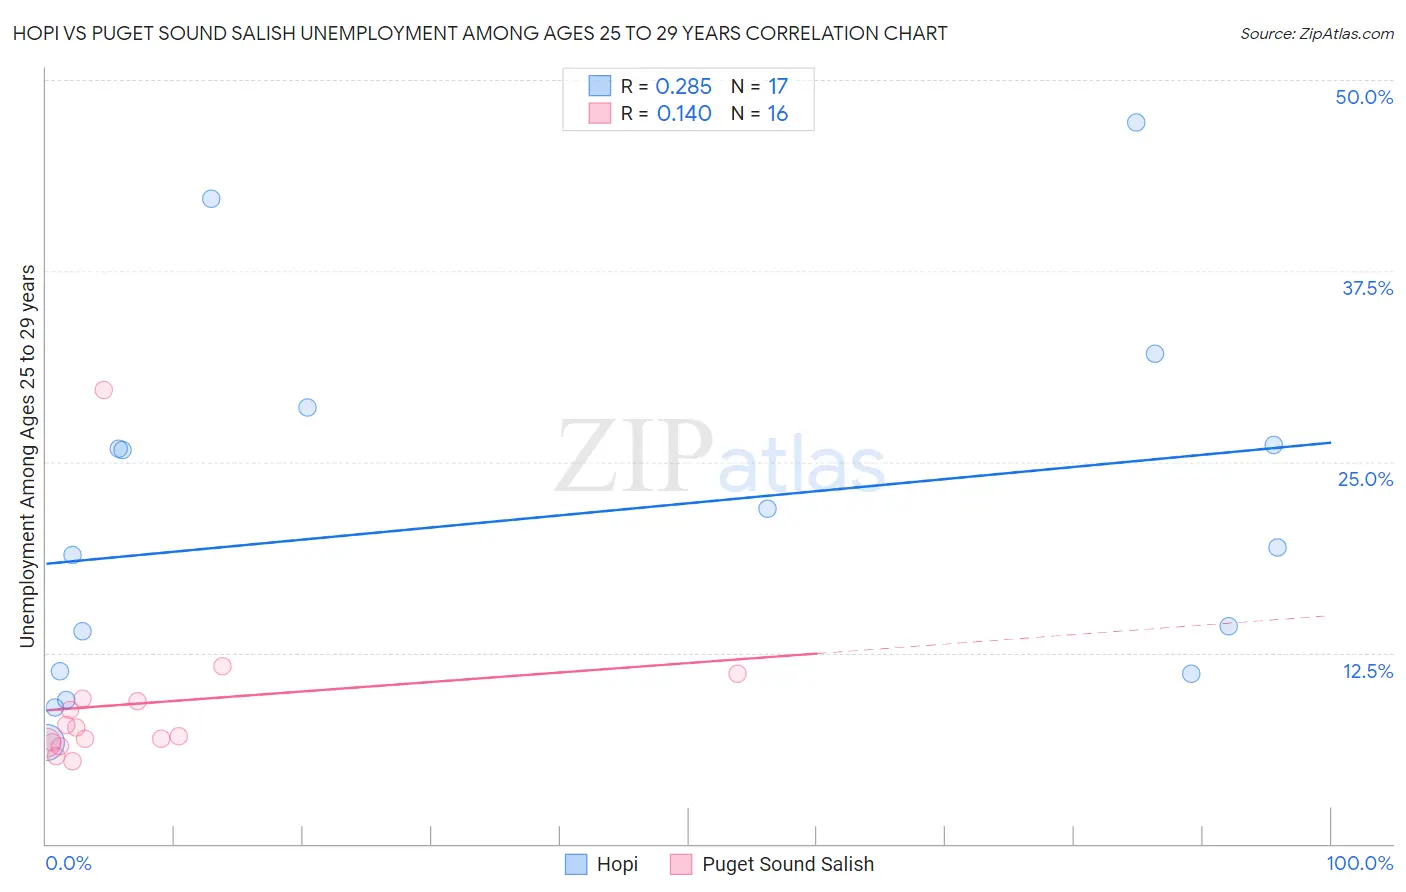
Hopi vs Puget Sound Salish Unemployment Among Ages 25 to 29 years Correlation Chart
The statistical analysis conducted on geographies consisting of 74,011,097 people shows a weak positive correlation between the proportion of Hopi and unemployment rate among population between the ages 25 and 29 in the United States with a correlation coefficient (R) of 0.285 and weighted average of 13.5%. Similarly, the statistical analysis conducted on geographies consisting of 45,327,294 people shows a poor positive correlation between the proportion of Puget Sound Salish and unemployment rate among population between the ages 25 and 29 in the United States with a correlation coefficient (R) of 0.140 and weighted average of 7.1%, a difference of 91.5%.
Unemployment Among Ages 25 to 29 years Correlation Summary
| Measurement | Hopi | Puget Sound Salish |
| Minimum | 6.6% | 5.4% |
| Maximum | 47.2% | 29.7% |
| Range | 40.6% | 24.4% |
| Mean | 21.4% | 9.2% |
| Median | 19.4% | 7.3% |
| Interquartile 25% (IQ1) | 11.2% | 6.6% |
| Interquartile 75% (IQ3) | 27.3% | 9.4% |
| Interquartile Range (IQR) | 16.2% | 2.8% |
| Standard Deviation (Sample) | 11.6% | 5.8% |
| Standard Deviation (Population) | 11.3% | 5.6% |
Similar Demographics by Unemployment Among Ages 25 to 29 years
Demographics Similar to Hopi by Unemployment Among Ages 25 to 29 years
In terms of unemployment among ages 25 to 29 years, the demographic groups most similar to Hopi are Inupiat (13.4%, a difference of 0.65%), Navajo (12.2%, a difference of 11.0%), Tohono O'odham (12.1%, a difference of 11.9%), Arapaho (15.4%, a difference of 13.7%), and Crow (15.4%, a difference of 13.8%).
| Demographics | Rating | Rank | Unemployment Among Ages 25 to 29 years |
| Alaskan Athabascans | 0.0 /100 | #333 | Tragic 10.8% |
| Yuman | 0.0 /100 | #334 | Tragic 11.0% |
| Puerto Ricans | 0.0 /100 | #335 | Tragic 11.1% |
| Lumbee | 0.0 /100 | #336 | Tragic 11.2% |
| Menominee | 0.0 /100 | #337 | Tragic 11.3% |
| Sioux | 0.0 /100 | #338 | Tragic 11.7% |
| Pima | 0.0 /100 | #339 | Tragic 11.8% |
| Cheyenne | 0.0 /100 | #340 | Tragic 11.8% |
| Tohono O'odham | 0.0 /100 | #341 | Tragic 12.1% |
| Navajo | 0.0 /100 | #342 | Tragic 12.2% |
| Inupiat | 0.0 /100 | #343 | Tragic 13.4% |
| Hopi | 0.0 /100 | #344 | Tragic 13.5% |
| Arapaho | 0.0 /100 | #345 | Tragic 15.4% |
| Crow | 0.0 /100 | #346 | Tragic 15.4% |
| Yup'ik | 0.0 /100 | #347 | Tragic 17.9% |
Demographics Similar to Puget Sound Salish by Unemployment Among Ages 25 to 29 years
In terms of unemployment among ages 25 to 29 years, the demographic groups most similar to Puget Sound Salish are Honduran (7.1%, a difference of 0.020%), Cape Verdean (7.0%, a difference of 0.070%), Panamanian (7.0%, a difference of 0.21%), French Canadian (7.0%, a difference of 0.37%), and Immigrants from Honduras (7.0%, a difference of 0.39%).
| Demographics | Rating | Rank | Unemployment Among Ages 25 to 29 years |
| Immigrants | El Salvador | 3.6 /100 | #230 | Tragic 7.0% |
| Central Americans | 3.0 /100 | #231 | Tragic 7.0% |
| Spanish Americans | 2.7 /100 | #232 | Tragic 7.0% |
| Immigrants | Honduras | 2.4 /100 | #233 | Tragic 7.0% |
| French Canadians | 2.4 /100 | #234 | Tragic 7.0% |
| Panamanians | 2.1 /100 | #235 | Tragic 7.0% |
| Cape Verdeans | 1.9 /100 | #236 | Tragic 7.0% |
| Puget Sound Salish | 1.8 /100 | #237 | Tragic 7.1% |
| Hondurans | 1.8 /100 | #238 | Tragic 7.1% |
| Potawatomi | 1.3 /100 | #239 | Tragic 7.1% |
| Native Hawaiians | 1.3 /100 | #240 | Tragic 7.1% |
| Immigrants | Sierra Leone | 1.3 /100 | #241 | Tragic 7.1% |
| Spanish American Indians | 1.1 /100 | #242 | Tragic 7.1% |
| Yaqui | 1.0 /100 | #243 | Tragic 7.1% |
| Immigrants | Nonimmigrants | 0.9 /100 | #244 | Tragic 7.1% |