Seminole vs Immigrants from Belarus Female Poverty

COMPARE

Seminole
Race
Ancestry
AfghanAfricanAlaska NativeAlaskan AthabascanAlbanianAleutAlsatianAmericanApacheArabArapahoArgentineanArmenianAssyrian/Chaldean/SyriacAustralianAustrianBahamianBangladeshiBarbadianBasqueBelgianBelizeanBermudanBhutaneseBlackfeetBolivianBrazilianBritishBritish West IndianBulgarianBurmeseCajunCambodianCanadianCape VerdeanCarpatho RusynCelticCentral AmericanCentral American IndianCherokeeCheyenneChickasawChileanChineseChippewaChoctawColombianColvilleComancheCosta RicanCreeCreekCroatianCrowCubanCypriotCzechCzechoslovakianDanishDelawareDominicanDutchDutch West IndianEastern EuropeanEcuadorianEgyptianEnglishEstonianEthiopianEuropeanFijianFilipinoFinnishFrenchFrench American IndianFrench CanadianGermanGerman RussianGhanaianGreekGuamanian/ChamorroGuatemalanGuyaneseHaitianHmongHonduranHopiHoumaHungarianIcelanderIndian (Asian)IndonesianInupiatIranianIraqiIrishIroquoisIsraeliItalianJamaicanJapaneseJordanianKenyanKiowaKoreanLaotianLatvianLebaneseLiberianLithuanianLumbeeLuxembourgerMacedonianMalaysianMalteseMarshalleseMenomineeMexicanMexican American IndianMongolianMoroccanNative HawaiianNavajoNepaleseNew ZealanderNicaraguanNigerianNorthern EuropeanNorwegianOkinawanOsageOttawaPaiutePakistaniPalestinianPanamanianParaguayanPennsylvania GermanPeruvianPimaPolishPortuguesePotawatomiPuebloPuerto RicanPuget Sound SalishRomanianRussianSalvadoranSamoanScandinavianScotch-IrishScottishSeminoleSenegaleseSerbianShoshoneSierra LeoneanSiouxSlavicSlovakSloveneSomaliSouth AfricanSouth AmericanSouth American IndianSoviet UnionSpaniardSpanishSpanish AmericanSpanish American IndianSri LankanSubsaharan AfricanSudaneseSwedishSwissSyrianTaiwaneseThaiTlingit-HaidaTohono O'OdhamTonganTrinidadian and TobagonianTsimshianTurkishU.S. Virgin IslanderUgandanUkrainianUruguayanUteVenezuelanVietnameseWelshWest IndianYakamaYaquiYugoslavianYumanYup'ikZimbabwean
Immigration
NonimmigrantsImmigrantsAfghanistanAfricaAlbaniaArgentinaArmeniaAsiaAustraliaAustriaBahamasBangladeshBarbadosBelgiumBelizeBoliviaBosnia and HerzegovinaBrazilBulgariaBurma/MyanmarCabo VerdeCambodiaCameroonCanadaCaribbeanCentral AmericaChileChinaColombiaCongoCosta RicaCroatiaCubaCzechoslovakiaDenmarkDominicaDominican RepublicEastern AfricaEastern AsiaEastern EuropeEcuadorEgyptEl SalvadorEnglandEritreaEthiopiaEuropeFijiFranceGermanyGhanaGreeceGrenadaGuatemalaGuyanaHaitiHondurasHong KongHungaryIndiaIndonesiaIranIraqIrelandIsraelItalyJamaicaJapanJordanKazakhstanKenyaKoreaKuwaitLaosLatin AmericaLatviaLebanonLiberiaLithuaniaMalaysiaMexicoMicronesiaMiddle AfricaMoldovaMoroccoNepalNetherlandsNicaraguaNigeriaNorth AmericaNorth MacedoniaNorthern AfricaNorthern EuropeNorwayOceaniaPakistanPanamaPeruPhilippinesPolandPortugalRomaniaRussiaSaudi ArabiaScotlandSenegalSerbiaSierra LeoneSingaporeSomaliaSouth AfricaSouth AmericaSouth Central AsiaSouth Eastern AsiaSouthern EuropeSpainSri LankaSt. Vincent and the GrenadinesSudanSwedenSwitzerlandSyriaTaiwanThailandTrinidad and TobagoTurkeyUgandaUkraineUruguayUzbekistanVenezuelaVietnamWest IndiesWestern AfricaWestern AsiaWestern EuropeYemenZaireZimbabweAzores
Immigrants from Belarus
Race
Ancestry
AfghanAfricanAlaska NativeAlaskan AthabascanAlbanianAleutAlsatianAmericanApacheArabArapahoArgentineanArmenianAssyrian/Chaldean/SyriacAustralianAustrianBahamianBangladeshiBarbadianBasqueBelgianBelizeanBermudanBhutaneseBlackfeetBolivianBrazilianBritishBritish West IndianBulgarianBurmeseCajunCambodianCanadianCape VerdeanCarpatho RusynCelticCentral AmericanCentral American IndianCherokeeCheyenneChickasawChileanChineseChippewaChoctawColombianColvilleComancheCosta RicanCreeCreekCroatianCrowCubanCypriotCzechCzechoslovakianDanishDelawareDominicanDutchDutch West IndianEastern EuropeanEcuadorianEgyptianEnglishEstonianEthiopianEuropeanFijianFilipinoFinnishFrenchFrench American IndianFrench CanadianGermanGerman RussianGhanaianGreekGuamanian/ChamorroGuatemalanGuyaneseHaitianHmongHonduranHopiHoumaHungarianIcelanderIndian (Asian)IndonesianInupiatIranianIraqiIrishIroquoisIsraeliItalianJamaicanJapaneseJordanianKenyanKiowaKoreanLaotianLatvianLebaneseLiberianLithuanianLumbeeLuxembourgerMacedonianMalaysianMalteseMarshalleseMenomineeMexicanMexican American IndianMongolianMoroccanNative HawaiianNavajoNepaleseNew ZealanderNicaraguanNigerianNorthern EuropeanNorwegianOkinawanOsageOttawaPaiutePakistaniPalestinianPanamanianParaguayanPennsylvania GermanPeruvianPimaPolishPortuguesePotawatomiPuebloPuerto RicanPuget Sound SalishRomanianRussianSalvadoranSamoanScandinavianScotch-IrishScottishSenegaleseSerbianShoshoneSierra LeoneanSiouxSlavicSlovakSloveneSomaliSouth AfricanSouth AmericanSouth American IndianSoviet UnionSpaniardSpanishSpanish AmericanSpanish American IndianSri LankanSubsaharan AfricanSudaneseSwedishSwissSyrianTaiwaneseThaiTlingit-HaidaTohono O'OdhamTonganTrinidadian and TobagonianTsimshianTurkishU.S. Virgin IslanderUgandanUkrainianUruguayanUteVenezuelanVietnameseWelshWest IndianYakamaYaquiYugoslavianYumanYup'ikZimbabwean
Immigration
NonimmigrantsImmigrantsAfghanistanAfricaAlbaniaArgentinaArmeniaAsiaAustraliaAustriaBahamasBangladeshBarbadosBelarusBelgiumBelizeBoliviaBosnia and HerzegovinaBrazilBulgariaBurma/MyanmarCabo VerdeCambodiaCameroonCanadaCaribbeanCentral AmericaChileChinaColombiaCongoCosta RicaCroatiaCubaCzechoslovakiaDenmarkDominicaDominican RepublicEastern AfricaEastern AsiaEastern EuropeEcuadorEgyptEl SalvadorEnglandEritreaEthiopiaEuropeFijiFranceGermanyGhanaGreeceGrenadaGuatemalaGuyanaHaitiHondurasHong KongHungaryIndiaIndonesiaIranIraqIrelandIsraelItalyJamaicaJapanJordanKazakhstanKenyaKoreaKuwaitLaosLatin AmericaLatviaLebanonLiberiaLithuaniaMalaysiaMexicoMicronesiaMiddle AfricaMoldovaMoroccoNepalNetherlandsNicaraguaNigeriaNorth AmericaNorth MacedoniaNorthern AfricaNorthern EuropeNorwayOceaniaPakistanPanamaPeruPhilippinesPolandPortugalRomaniaRussiaSaudi ArabiaScotlandSenegalSerbiaSierra LeoneSingaporeSomaliaSouth AfricaSouth AmericaSouth Central AsiaSouth Eastern AsiaSouthern EuropeSpainSri LankaSt. Vincent and the GrenadinesSudanSwedenSwitzerlandSyriaTaiwanThailandTrinidad and TobagoTurkeyUgandaUkraineUruguayUzbekistanVenezuelaVietnamWest IndiesWestern AfricaWestern AsiaWestern EuropeYemenZaireZimbabweAzores
Female Poverty
Income
Poverty
Unemployment
Labor Participation
Family Structure
Vehicle Availability
Education Level
Disability

Female Poverty Comparison

Seminole

Immigrants from Belarus

Tragic
Excellent
16.9%
FEMALE POVERTY
0.0/ 100
METRIC RATING
307th/ 347
METRIC RANK
12.8%
FEMALE POVERTY
88.2/ 100
METRIC RATING
128th/ 347
METRIC RANK

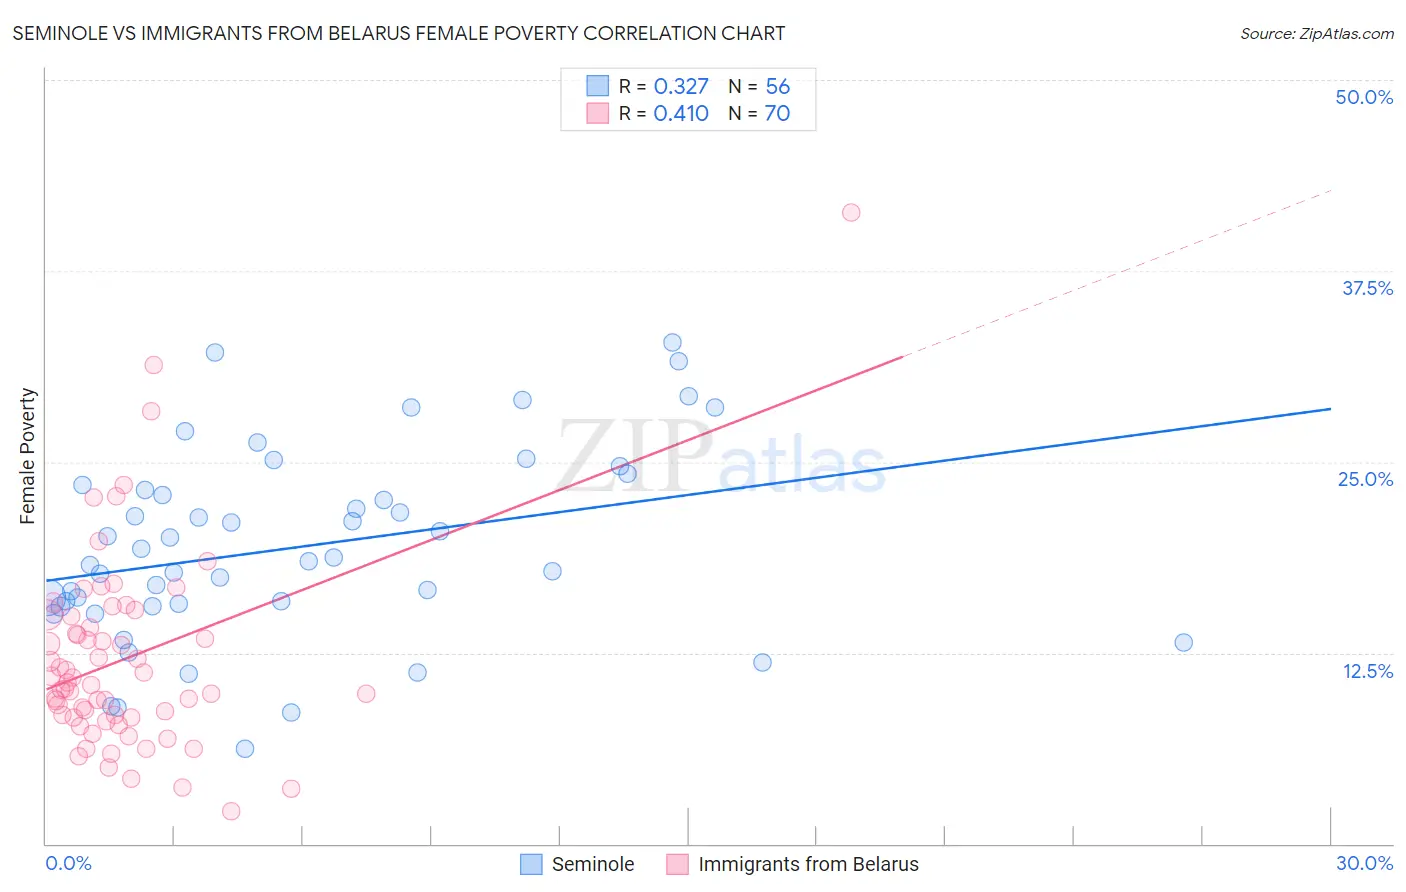
Seminole vs Immigrants from Belarus Female Poverty Correlation Chart

The statistical analysis conducted on geographies consisting of 118,292,292 people shows a mild positive correlation between the proportion of Seminole and poverty level among females in the United States with a correlation coefficient (R) of 0.327 and weighted average of 16.9%. Similarly, the statistical analysis conducted on geographies consisting of 150,175,369 people shows a moderate positive correlation between the proportion of Immigrants from Belarus and poverty level among females in the United States with a correlation coefficient (R) of 0.410 and weighted average of 12.8%, a difference of 32.0%.
Seminole vs Immigrants from Belarus Female Poverty

Female Poverty Correlation Summary

MeasurementSeminoleImmigrants from Belarus
Minimum6.2%2.1%
Maximum32.8%41.3%
Range26.6%39.2%
Mean19.4%12.1%
Median18.6%10.5%
Interquartile 25% (IQ1)15.6%8.3%
Interquartile 75% (IQ3)23.3%14.9%
Interquartile Range (IQR)7.7%6.6%
Standard Deviation (Sample)6.2%6.5%
Standard Deviation (Population)6.2%6.5%

Similar Demographics by Female Poverty

Demographics Similar to Seminole by Female Poverty

In terms of female poverty, the demographic groups most similar to Seminole are African (16.9%, a difference of 0.060%), Immigrants from Caribbean (16.9%, a difference of 0.12%), Immigrants from Grenada (16.8%, a difference of 0.39%), Immigrants from Central America (16.8%, a difference of 0.40%), and Immigrants from Mexico (17.0%, a difference of 0.45%).
DemographicsRating | RankFemale Poverty
Bahamians
0.0
/100
|
#300
Tragic
16.6%
Guatemalans
0.0
/100
|
#301
Tragic
16.7%
Chippewa
0.0
/100
|
#302
Tragic
16.7%
Choctaw
0.0
/100
|
#303
Tragic
16.8%
Immigrants | Central America
0.0
/100
|
#304
Tragic
16.8%
Immigrants | Grenada
0.0
/100
|
#305
Tragic
16.8%
Immigrants | Caribbean
0.0
/100
|
#306
Tragic
16.9%
Seminole
0.0
/100
|
#307
Tragic
16.9%
Africans
0.0
/100
|
#308
Tragic
16.9%
Immigrants | Mexico
0.0
/100
|
#309
Tragic
17.0%
Creek
0.0
/100
|
#310
Tragic
17.0%
Immigrants | Guatemala
0.0
/100
|
#311
Tragic
17.0%
Immigrants | Somalia
0.0
/100
|
#312
Tragic
17.0%
British West Indians
0.0
/100
|
#313
Tragic
17.0%
Dutch West Indians
0.0
/100
|
#314
Tragic
17.1%

Demographics Similar to Immigrants from Belarus by Female Poverty

In terms of female poverty, the demographic groups most similar to Immigrants from Belarus are South African (12.8%, a difference of 0.040%), Immigrants from Brazil (12.8%, a difference of 0.070%), Immigrants from Ukraine (12.8%, a difference of 0.14%), Argentinean (12.8%, a difference of 0.22%), and Immigrants from Norway (12.8%, a difference of 0.27%).
DemographicsRating | RankFemale Poverty
Immigrants | Hungary
90.3
/100
|
#121
Exceptional
12.7%
French Canadians
90.2
/100
|
#122
Exceptional
12.7%
Immigrants | South Eastern Asia
89.9
/100
|
#123
Excellent
12.7%
Immigrants | Norway
89.3
/100
|
#124
Excellent
12.8%
Argentineans
89.1
/100
|
#125
Excellent
12.8%
Immigrants | Ukraine
88.8
/100
|
#126
Excellent
12.8%
South Africans
88.4
/100
|
#127
Excellent
12.8%
Immigrants | Belarus
88.2
/100
|
#128
Excellent
12.8%
Immigrants | Brazil
87.9
/100
|
#129
Excellent
12.8%
Immigrants | Vietnam
87.1
/100
|
#130
Excellent
12.8%
Immigrants | Argentina
87.0
/100
|
#131
Excellent
12.8%
Immigrants | Jordan
86.9
/100
|
#132
Excellent
12.8%
Immigrants | Western Europe
86.6
/100
|
#133
Excellent
12.8%
Immigrants | Switzerland
85.8
/100
|
#134
Excellent
12.9%
French
85.6
/100
|
#135
Excellent
12.9%