Hmong vs Immigrants from Belarus In Labor Force | Age 16-19
COMPARE
Hmong
Immigrants from Belarus
In Labor Force | Age 16-19
In Labor Force | Age 16-19 Comparison
Hmong
Immigrants from Belarus
38.7%
IN LABOR FORCE | AGE 16-19
99.1/ 100
METRIC RATING
101st/ 347
METRIC RANK
33.4%
IN LABOR FORCE | AGE 16-19
0.1/ 100
METRIC RATING
291st/ 347
METRIC RANK
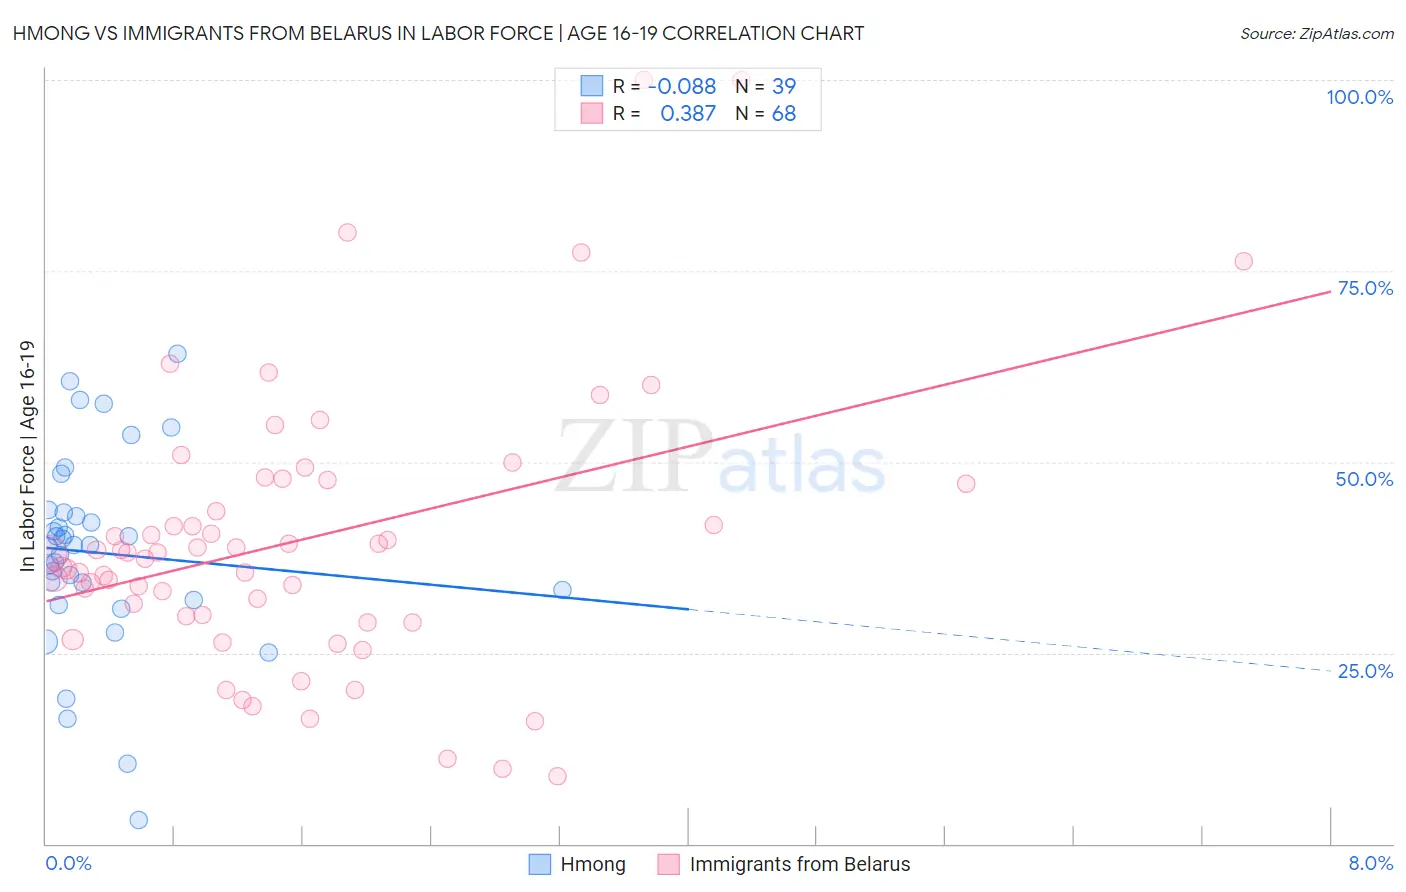
Hmong vs Immigrants from Belarus In Labor Force | Age 16-19 Correlation Chart
The statistical analysis conducted on geographies consisting of 24,681,034 people shows a slight negative correlation between the proportion of Hmong and labor force participation rate among population between the ages 16 and 19 in the United States with a correlation coefficient (R) of -0.088 and weighted average of 38.7%. Similarly, the statistical analysis conducted on geographies consisting of 150,086,766 people shows a mild positive correlation between the proportion of Immigrants from Belarus and labor force participation rate among population between the ages 16 and 19 in the United States with a correlation coefficient (R) of 0.387 and weighted average of 33.4%, a difference of 15.8%.
In Labor Force | Age 16-19 Correlation Summary
| Measurement | Hmong | Immigrants from Belarus |
| Minimum | 3.1% | 8.8% |
| Maximum | 64.2% | 100.0% |
| Range | 61.1% | 91.2% |
| Mean | 38.1% | 39.8% |
| Median | 39.1% | 38.0% |
| Interquartile 25% (IQ1) | 31.9% | 29.9% |
| Interquartile 75% (IQ3) | 43.4% | 47.4% |
| Interquartile Range (IQR) | 11.5% | 17.5% |
| Standard Deviation (Sample) | 12.9% | 18.1% |
| Standard Deviation (Population) | 12.7% | 17.9% |
Similar Demographics by In Labor Force | Age 16-19
Demographics Similar to Hmong by In Labor Force | Age 16-19
In terms of in labor force | age 16-19, the demographic groups most similar to Hmong are Zimbabwean (38.7%, a difference of 0.010%), Immigrants from Cameroon (38.7%, a difference of 0.040%), Immigrants from Thailand (38.7%, a difference of 0.070%), Immigrants from Eritrea (38.7%, a difference of 0.090%), and Iraqi (38.6%, a difference of 0.25%).
| Demographics | Rating | Rank | In Labor Force | Age 16-19 |
| Immigrants | Canada | 99.4 /100 | #94 | Exceptional 38.9% |
| Immigrants | North America | 99.4 /100 | #95 | Exceptional 38.9% |
| Latvians | 99.4 /100 | #96 | Exceptional 38.9% |
| Greeks | 99.3 /100 | #97 | Exceptional 38.9% |
| Ugandans | 99.3 /100 | #98 | Exceptional 38.9% |
| Immigrants | North Macedonia | 99.3 /100 | #99 | Exceptional 38.9% |
| Immigrants | Thailand | 99.1 /100 | #100 | Exceptional 38.7% |
| Hmong | 99.1 /100 | #101 | Exceptional 38.7% |
| Zimbabweans | 99.1 /100 | #102 | Exceptional 38.7% |
| Immigrants | Cameroon | 99.0 /100 | #103 | Exceptional 38.7% |
| Immigrants | Eritrea | 99.0 /100 | #104 | Exceptional 38.7% |
| Iraqis | 98.9 /100 | #105 | Exceptional 38.6% |
| Delaware | 98.8 /100 | #106 | Exceptional 38.6% |
| Chinese | 98.8 /100 | #107 | Exceptional 38.6% |
| Immigrants | Ethiopia | 98.7 /100 | #108 | Exceptional 38.6% |
Demographics Similar to Immigrants from Belarus by In Labor Force | Age 16-19
In terms of in labor force | age 16-19, the demographic groups most similar to Immigrants from Belarus are Haitian (33.4%, a difference of 0.060%), Immigrants from Colombia (33.5%, a difference of 0.080%), Immigrants from Singapore (33.5%, a difference of 0.21%), Immigrants from Indonesia (33.5%, a difference of 0.22%), and Nepalese (33.5%, a difference of 0.25%).
| Demographics | Rating | Rank | In Labor Force | Age 16-19 |
| Immigrants | Spain | 0.2 /100 | #284 | Tragic 33.7% |
| U.S. Virgin Islanders | 0.2 /100 | #285 | Tragic 33.6% |
| South Americans | 0.2 /100 | #286 | Tragic 33.6% |
| Nepalese | 0.1 /100 | #287 | Tragic 33.5% |
| Immigrants | Indonesia | 0.1 /100 | #288 | Tragic 33.5% |
| Immigrants | Singapore | 0.1 /100 | #289 | Tragic 33.5% |
| Immigrants | Colombia | 0.1 /100 | #290 | Tragic 33.5% |
| Immigrants | Belarus | 0.1 /100 | #291 | Tragic 33.4% |
| Haitians | 0.1 /100 | #292 | Tragic 33.4% |
| Immigrants | South America | 0.1 /100 | #293 | Tragic 33.3% |
| Argentineans | 0.1 /100 | #294 | Tragic 33.3% |
| Yup'ik | 0.1 /100 | #295 | Tragic 33.3% |
| Jamaicans | 0.1 /100 | #296 | Tragic 33.2% |
| Immigrants | Haiti | 0.1 /100 | #297 | Tragic 33.2% |
| Iranians | 0.0 /100 | #298 | Tragic 33.0% |